Comparing
MODE
The modes are:
ADULTS BOOK- 3 letters per word
CHILDS BOOK- 3 letters per word
The mode is the same because they both have the most entries.
RANGE
The ranges are:
ADULTS BOOK- 12
CHILDS BOOK- 9
The adult’s book has a higher range than the child’s book; therefore the adult’s book has longer words!
MEAN
The averages are:
Adults book- 4 letters per word
Childs book- 3 letters per word
On average the adults book has more letters per word than the Childs book this is because the MEAN is a higher number than the Childs book, as it is 4 and the Childs book is 3.
MEDIAN
The middle values are:
Adult’s book- 4
Childs book-4
There median is the same for both of them this is because the median shows the most common value, which in this case is four.
Outcome
Adults book
The adult’s book has:
The same mode
A larger range
A higher mean
A larger median
Childs book
The Childs book has:
A same mode
Less of a range
A lower mean
Median is lower
Now that I have got all of my results I will present them in different ways and show ways of comparing them.
- Box plots
- Pie charts
- Frequency polygons
- Frequency graphs
- Cumulative frequency
- Histograms
These are just some examples of showing different ways of showing these results!
Inter-quartile range and box plots
Adult’s book- Results- Letters per word
1 2 3 4 5 6 7 8 9 10 11 12 13
1st quartile= 3.5
2nd quartile= 7
3rd quartile= 10.5
Childs book- Results- Letters per word
1 2 3 4 5 6 7 8 9 10
1st quartile= 2.5
2nd quartile= 5
3rd quartile= 7.5
Box plots- no. Of letters per word
Pie charts
Now I am going to show another way of presenting my data using a pie chart
Adults book
No. Of words= 871
360/871= 0.4
0.4 per 1, number of letters per word
Pie chart on graph paper 1a
Childs book
No of words= 441
360/441= 0.83
0.82 per 1: no. Of letters per word
(Because I have rounded the actual results to a whole number, the overall total was one less than 360 so I have added an extra 1 degrees to one of the results this shouldn’t affect the final result!)
Pie chart on graph paper 1b
Frequency polygons and graphs
Adults book
Childs book
Frequency polygon on graph paper 3a
Cumulative frequency graphs
Adults book
Cumulative frequency polygons on graph paper 2a
Childs book
Histograms
Adults book
HISTOGRAM ON GRAPH PAPER 2b
Childs book
HISTOGRAM ON GRAPH PAPER 3B
Analysis
Box plots
By looking at the tally charts and box plots from both the adults and child’s books it shows that there is a larger range from the adult’s book. It has a range of 13 and a range of 10 from the child’s book. The median is also a lot higher. The adult’s book has 7 compared to the 5 for the child’s book (a difference of two letters per word.) The inter quartile range is similar though. The adult’s book has an I.Q.R of 7 and the child’s is 5. The upper and lower quartiles are both higher from the adult’s book. The adult’s book has an upper quartile of 10.5 and the child’s has 7.5. The lower quartile is 3.5 for the adult’s book and 2.5 for the child’s. This suggests that the adult’s book has more letters on average than the child’s book, but this is only from a small section.
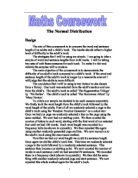
Histograms and frequency polygons:
Both histograms and frequency polygons indicate that both books have a normal distribution of values. The numbers of letters per word both increase until they get to 3 (the mode), then they gradually decrease. The adult’s book is at a higher point throughout most of the graphs and it lasts longer against the range than the child’s book. This again shows that the adult’s book has more letters per word than the child’s book.
Cumulative frequency curves
Both curves have a similar shape; this shape is the shape of values that are in a normal distribution. The cumulative frequency curve for the adult’s book is has a slightly steeper incline and the median is further along the axis than the cumulative frequency curve for the child’s book. This shows that the adult’s book has more of a normal distribution than the child’s book does and that the values in the adult’s book are on average higher than the child’s book. The curve for the adult’s book is smoother towards the end than the child’s book.
Pie charts
Both pie charts clearly show the proportion of the number of letters per word. You can obviously see which number has the most outcomes and which has the least. I think a pie chart is a good way for showing clearly the proportions.
CONCLUSION/EVALUATION
THE ADULTS BOOK HAS MORE LETTERS PER WORD THAN THE CHILDS BOOK!
In relation to my hypothesis my prediction was correct:
“That the child’s book will have less numbers of letters in words than the adults”
I thought this because a child does not know a wide range of vocabulary. As a result the words would be shorter. As for an adult they clearly know a wider range of vocabulary therefore they will know long complicated words.
Although the adult’s book has on average got more letters per word than the child’s book, it does not mean that it is conclusive. There is only a small sample, which has been taken.
I cannot be sure that the outcome I have shown is genuine, because the data I got could be due to chance. To get more reliable results I could collect more results or do this with several books to see if it is true with all of the novels. To find out if my data gives strong enough evidence for my conclusion I could do a statistical test.
My conclusion may not be definite. Word size may not mean that the book is more profound or easier to read, this assumption I have made may be false and overthrow the investigation, this means that without getting more results I cannot say it is a genuine conclusion. If there was more time, to extend this task further I could of maybe compared the size and number of pictures in the adults and child’s books and see if there was any correlation. I did not have enough time to do this because after I had taken all of the first set of results I decided to do the child’s book again because the results of the first one were too close together; so I did another set too make the results more comprehensible as I have shown.