I carried out a pilot study before I made my final decisions on how I will collect and show my data. I found that the best way to collect my data was in words per sentence and letters per word. The pilot study showed that the words per sentence were shown better in a grouped frequency table than a frequency table. This is because in a grouped frequency table, there is quite a big difference between the smallest and highest number of words per sentence so it is better to have groups to get a reasonable frequency per group. Another reason is that there are lots of ways the data in a grouped table can be displayed such as histograms, cumulative frequency diagrams and box and whisker diagrams. For the letters per word, the pilot study showed that these were best shown in a frequency table as diagrams such as stem and leaf diagrams, to me, showed the results well.
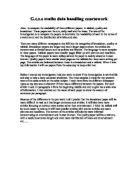
As mentioned before, I have decided to take two different variables, the words per sentence and the letters per word as, through the pilot study that I carried out before I started, I found that I can use these more accurately in the data collection and presentation. To avoid any biased results as mentioned before, I will type the articles out onto Microsoft Word, as they appear on the newspaper, and it will tell me three things, the sentence per paragraph (which I will not be using), the average words per sentence and the average characters per word. Using Microsoft Word will prevent any bias as it will always count all the words in exactly the same way so it doesn’t matter how I will treat characters such as hyphens as the program will count them same way every time. After doing this, I will randomly choose 100 words from the article by using a random number generator on Microsoft Excel by using the formula RAND()*(500-1)+1 as an example and this will generate a random number greater than or equal to 1 but less than 500, so then I would simply return to the articles and find the corresponding word number that is generated on Excel and record the amount of letters in that word. If any words are chosen more than once, I will just ignore them and generate another random number. To get the sentence lengths, I will again use the random number generator to find 20 randomly selected sentences and when a number such as 12 is generated, I will find the 12th sentence in both articles and count how many words are in it. If a sentence comes up twice, then once again, I will just ignore it and generate another random number and carry on. As the articles are not exactly the same length, If a number is generated but there are not enough words in one of the articles, I will ignore this and generate another number, for example, if one of my articles has 500 words and the other has 600 words and the number 514 is generated, then I will ignore this number, as it is not possible to find it number in both articles.
To make the comparison fair, I will do the same things for both articles like finding the same word number – if the number 45 is generated, I will find the 45th word in both articles and count how many letters it has. Also, instead of counting the word lengths and sentence length myself, I can use Microsoft Word to do it to try and avoid human error in case I make a mistake by the selecting the word or sentence and clicking on, TOOLS, WORD COUNT tabs on the menu. For finding the mean (= AVERAGE), median (= MEDIAN), mode (= MODE) and standard deviation (= STDEVP) I will use formulas in Microsoft Excel, which are the words in brackets.
Investigation Into Word Lengths
Calculations
Analysis Of Word Lengths
The bar chart above shows the word lengths collected from both papers with the older paper being the blue bars and the newer paper being the purple bars. The graph easily shows the mode as this is the word length that is seen the most as you just look for the bar that is furthest to the left and the old newspaper has the higher mode suggesting that it has longer words, but the other calculations were done on Microsoft Excel using formulas as mentioned before. The median for the word length in the papers was the same for both which I find quite surprising considering my original hypothesis, as I would have expected the median to be much higher in the older paper. The mean is also surprising as I would have expected this to also be a lot higher than the new paper, instead of being only slightly higher. The new paper has the higher standard deviation, which tells me it has more variation from the mean than the old paper but this could be having longer words, or shorter words.
Investigation Into Word Lengths
Calculations
Analysis Of Sentence Lengths
The frequency polygon above shows the sentence lengths collected from both papers with the older paper being the blue line and the newer paper being the yellow line. Once again the graph easily shows the mode as in this case, this is the sentence length that is seen the most as you just look where the line is at its highest, but the other calculations were done on Microsoft Excel using formulas as mentioned before. I found some of these findings very strange, as in my hypothesis I stated I thought there would be more words per sentence in the old paper, but the median suggests that this is not the case as the newer paper has a much higher median than the older paper which suggests that there were more longer words, but the old paper still has a slightly higher mean which suggests that the older paper has longer words overall. The standard deviation in this case are very similar and are quite low which tells me that there isn’t much variation from the mean.
Summary
Overall I think that my hypothesis was proved right, but it was not as clear as I thought that it would be before is started. For word lengths, the median was the same for both papers, whereas I would have expected the old paper to have a higher median than the new paper, like the mean as I predicted longer words. In the word lengths, the mean was higher in the old paper, but wasn’t mush higher, which suggests that the method was not as good as it could have been, given more time. In the sentence lengths is where my hypothesis could be disproved, as here, the newer paper has by far the higher median which suggests that is also has longer sentences, but the older paper had the overall higher mean, but once again, it wasn’t as conclusive as I think it could have been, had I been given more time. The standard deviations in both the word and sentence lengths didn’t help much with proving my hypothesis, as there was not a big margin between the two papers, especially with sentence lengths.
Improvements
As I’ve mentioned above in the summary, the test was not as conclusive as I think it could have been if I had more time like the random number generation as I don’t think this was fair as when I read the two articles beforehand, I could see myself that the older paper had much longer words and sentences than the new paper, yet, this didn’t seem to be the case when all the findings were added up as all the longer words seem to have been missed out of the old paper and the longer words have been counted in the newer paper. Given more time, I would try and get all the words from each article, as to me, this is the only absolutely fair way of comparing the two articles, but even so, this could be an unfair comparison as well, as the articles are not the same length and so this could hinder the comparison yet again. If doing that still didn’t change the results then, I think that if I could do the comparison again, I would try and get a paper, which was even older than the one from 1989, as the paper from 1989 my be too recent and the writing style may not have actually changed at all, I think an article from the 1950’s or 1960’s would probably be a better idea. Also, instead of choosing just one article in the paper, I could choose 3 or 4 to give an even more definite result and the more things that are tested, the more accurate the outcome will be.