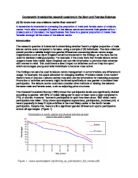
Research Design
A survey seems like the obvious research design. The researcher simply wishes to count the number of leisure centre users. However, if the study was to be extended, perhaps asking the reasons behind why individuals use the leisure centre, a questionnaire would be most appropriate for this type of data collection.
A survey is placed at the ‘applied’ end of the research aim continuum due to it having a real world setting with human subjects. It has high external validity (measuring what was intended with the ability to generalise results), but low internal validity (the assumption that the independent variable is solely responsible for any change in the dependent variable). In addition, the data gathered (collected as a primary source) is directly useful, for instance, in leisure centre planning and management. However, there is a lack of control when performing such a study which can be expected when collecting data in an open setting.
A survey is categorised under ‘descriptive research.’ According to Gratton and Jones (2004), descriptive research “describes a particular phenomenon, focusing upon the issue of what is happening, rather than why it is happening.”
Referring to the research designs continuum, there are three possible types of survey: cross-sectional, longitudinal and correlational. From my understanding, a cross-sectional survey would be performed, which is concerned with examining the status of items/people at the same point in time. It allows the researcher to analyse the difference between groups, in this case, male and female leisure centre usage. A cross-sectional study is efficient in terms of time and effort, ideal for collecting data quickly. The study is normative, ‘criterion referenced,’ which can be deduced from the fact the data took a ratio form; men:women.
The data takes the form of quantitative measurement, with a rating scale used to differentiate between men and women (i.e. men = 1, women = 2). Data is therefore nominal, as participants fall into two categories (dichotomous), either male or female. It is possible to assume from this data type that the researcher remained ‘aloof’ from the study, reducing the possibly of influencing the results. Data analysis involves statistical description, with the use of statistical tests to questions the significance of the results.
Hypotheses
H0 : There is an equal distribution of male and female leisure centre users.
HA : There are a greater proportion of male leisure centre users than females.
Results
Frequencies
Leisure Centre Usage
Chi-Square Test
Frequencies
Leisure Centre Usage
Chi- Squared Test Statistics
(a) 0 cells (.0%) have expected frequencies less than 5.
The minimum expected cell frequency is 25.0.
A Pie Chart showing the distribution of male
and female leisure centre users
A Bar Chart showing the number of male and female leisure centre users
Conclusion
There is sufficient evidence to reject the null hypothesis, and therefore accept the alternative hypothesis; there are a greater proportion of male leisure centre users than females. Using a chi squared test to analyse the data, it is possible to state that the result was statistically significant (p=0.048). The ‘observed frequencies’ differed significantly from the ‘expected frequencies.’ P = 0.048 means there is a 4.8% possibility the results were affected by chance factors. However, a value less than 0.05 is widely accepted to be significant result.
There are several considerable weaknesses in the investigation which should be taken into consideration, for example, the size of the sample. With only fifty people sampled from a single leisure centre, it is questionable whether any generalisations can be made. In addition, the sample is not totally random; therefore it fails to be a truly representative sample of the population. This would have been very difficult to achieve due to the manner in which the investigation was conducted.
(3)
A researcher believes good leg strength is a prerequisite for success in top-class rowing. She therefore recruits 8 international and 8 club standard rowers and measures their leg strength (in kg) once with a leg dynamometer. According to her hypothesis, the international rowers should be higher in leg strength than the club standard rowers. The researcher suspects that there are rowers in each sample who are “outliers”.
Introduction
The question is interested in determining whether there is correlation between the ability level of rowers and leg strength. The study involved 8 international rowers and 8 club rowers, who each had their leg strength measured once with a dynamometer. If it is proven that good leg strength is a prerequisite for success in top class rowing, this research would be beneficial to the sport. Amateur rowers with exceptional leg strength could be cited as having the potential to make it at an international level. With this knowledge they could be targeted for specialised training. However, it is important to point out that leg strength is only one of many variables involved in rowing.
Parkin, , Rutherford and McGregor (2001) studied whether leg strength and trunk musculature is more prominent in rowers than in a control group. Nineteen rowers and twenty male controls were matched for height, body mass and age and then using an isokenetic dynamometer, performed a series of leg strength tests.
“Knee extensor strength was significantly greater in the rowing population, but knee flexor strength was similar between the two groups. No difference was seen between the groups for the hamstring: quadriceps strength ratio”
Despite these results not showing differences between the two groups for each strength test, it does show that oarsmen have higher knee extensor strength compared to the control group. However, this investigation did not compare elite rowers to club rowers, but it can provide a base for the study being conducted, as it shows there is a relationship between knee extensor strength and level of performance.
Russell (1998) conducted a study which investigated predicting performance in 19 elite schoolboy rowers.
“The relationships between anthropometric characteristics, metabolic parameters, strength variables and 2000-m rowing ergometer performance time were analysed to test the hypothesis that a combination of these variables would predict performance better than either individual variables or one category of variables.”
As I am interested in the effect leg strength had on performance, I selected the relevant information from the results. This showed that knee extension strength correlated with 2000m performance time (r=-0.40, p= less than or equal to 0.05). In other words, the greater an athlete’s leg strength, the higher their level of performance. This study therefore supports the notion that international rowers will have superior leg strength to club rowers.
Research Design
With regards to the research design continuum, this study falls into the category of descriptive research, which is primarily concerned with status. It is a cross-sectional correlation study, examining the relationship between leg strength and performance level in rowers. This type of design is most valid for answering the question as cross-sectional studies involve testing different samples (in this case club and elite rowers) at the same point in time, therefore allowing the researcher to establish whether there is (or is not) a connection between the two variables (leg strength and performance level). However, it is not possible to attribute cause and affect. Just because two variables are correlated, this does not necessarily mean one variable causes the other variable to change.
The investigation is towards the ‘applied’ end of the research aim continuum, taking into account the real world settings with human participants (giving it high ecological validity), a lack of real control and directly useful results that can be used within the sport of rowing.
The data took the form of quantitative measurement, with leg strength being measured in kilograms. This form of measurement can be classified as continuous ratio data, as leg strength can assume any value and ‘zero’ implies the total absence of the characteristic. It is assumed that the data will be normally distributed.
Hypotheses
H0 :. There is no difference in leg strength between international and club rowers.
HA : International rowers have greater leg strength than club rowers.
Results
T-Test
Group Statistics
Independent Samples Test
Conclusion
Using the significance level returned by the independent samples test, I am able to reject the null hypothesis and accept the alternative one; international rowers have greater leg strength than club rowers. The figure p= 0.040 shows that the results are proven to be statistically significant, as any study with a ‘p’ value under 0.05 is widely agreed to have significant findings. The independent t test proved that the two sample means differed reliably from each other.
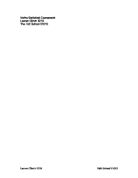
The high figures for standard deviation from the mean, especially in the international rowers’ sample (32.56 to 2d.p); can be attributed to a number of outliers. The data was very spread, which is shown in Figure 5.
References
Gratton, C, Jones, I. (2004) Research Methods for Sports Studies, London :Routledge
Mintel, Family Leisure Trends – UK – March 2000, accessed on 8/12/04
http://reports.mintel.com/sinatra/mintel/searchexec/type=reports&variants=true&fulltext=family/report/repcode=L220&anchor=accessL220/doc/396956339&repcode=L220#0
; ; ; (2001) Do oarsmen have asymmetries in the strength of their back and leg muscles?, Journal of sports sciences (London), Vol. 19 (7). p. 521-526
Russell, A.P (1998), Prediction of elite schoolboy 2000-m rowing ergometer performance from metabolic, anthropometric and strength variables, Journal of sports sciences (London), Vol.16 (8). p. 749-754
Sport England, Driving up participation: The challenge for sport, London: Sport England 2004, accessed on 10/12/04
Sport England, Women’s participation in sport - factsheet, London: Sport England 2002, accessed on 5/12/04
Thomas, J.R. and Nelson, J.K.; (1996); Research Methods in Physical Activity; Champaign: Human Kinetics.