Female Unconnected
Female Connected Words
Male Unconnected words
Male Connected Words
Displaying the Data
The data that I have will be easier to analyse if I summarise it in some sort of diagram. The data I have is discrete data which means it is whole numbers whereas things like temperature are an example of continuous data as if measured accurately enough they can take any appropriate value. There are many ways of displaying data such as.
Bar Charts and Vertical Line Charts
It is best to use bar charts to show categorical data and vertical line charts to show discrete data, although many people use them the round. The height of each bar or line indicates the frequency. Vertical line charts are best at showing discrete data as they show that the scores can only take an integer value. There are many different sorts of bar chart; such as compound, multiple, and normal. When drawing bar charts their should be gaps between the bars and the widths of the bars should be the same so as not to distort the data.
The best way to display my data is by a vertical line chart and by a multiple bar chart.
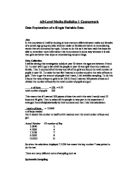
Vertical Line Chart of Male Connected Words
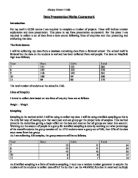
Vertical Line Chart of Male Unconnected Words
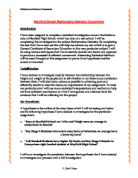
Vertical Line Chart of Female Connected Words
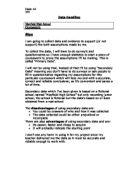
Vertical Line Chart of Female Unconnected Words
Analysis of the Vertical Line Charts
Male Connected Words
From this graph you can see that there are two modal values, 10 and 11. The modal values are in the middle of the chart but there is not much symmetry as for values less than 10 there is a negative gradient whereas for values greater than 11 there is a sharp gradient and a small peak. This shows that there is not much correlation and you cannot easily predict what a person chosen at random will get just by looking at the graph.
Male Unconnected Words
In this chart there is a clear unimodal value of 7 also the chart is symmetrical. From this you can see that a large percentage of people scored 7. This chart is easier to predict what someone chosen at random will get as so many people got 7.
Female Connected Words
As with the male connected words this chart is bimodal and positively skewed. This means that there are two modal values and they are towards the left hand side of the x-axis. This shows that a larger percentage of people got lower score compared with the others the two modal values are 7 and 10. 24% of people scored higher than 10 whereas 76% of people scored less than 10 this shows a large number of people scored less than 10. This supports my argument that males are better at dealing with words that are connected.
Female Unconnected Words
Unlike the male unconnected words the female were less symmetrical on their graph with a modal value of 5 although 7 and 9 were only 1 and 2 tally’s behind. The graph is quite erratic as in between the high peaks of 5, 7, and 9 are considerably smaller frequency. This one is hard to compare and I would need to do more calculations in order to make a comparison.
Analysis of Multiple Bar Chart
From the multiple bar chart it is easier to interpret data from the graph and find patterns. This is the best way of showing multiple discrete data or categorical data. It emphasises the size of the components in each group. From it you can see that the female modal value is clearly lower than the male modal value. You can also see a larger spread of data from the females.
Another way of manipulating the data is to do calculations relating to measures of central tendency and spread of data.
Measures of Central Tendency
When describing a typical value to represent a data set most people think of a value at the centre and use the word average. When using the word average they are often referring to the arithmetic mean, which is usually just called the mean.
There are actually several different average and in statistics you must be precise about to which you are referring. I calculated all of the following measures using a CASIO fx-9750G graphical calculator.
Mean
A sample size of n taken from a population can be identified as follows:
The first item can be called x1, the second item x2, and so on up to xn. The sum of these number of items can be given by x1+ x2+ x3+…+ xn, or written in short hand as Σxi, which means the sum of all the x items.
The mean is the sum of all the x items divided by the number of items an is written as x.
x= Σxf
n
These are the results for my data.
Male Connected
x= 10.62 2 d.p.
Male Unconnected Words
x= 7.15 2 d.p.
Female Connected Words
x= 8.54 2 d.p
Female Unconnected Words
x= 6.67 2 d.p
In my example the mean shows a good measure of central tendency as there are no outliers. Outliers are data that are extreme, either very high or very low, as a result of these outliers the mean will not show central tendency as well as it would with out these values. From the mean I can see that there was quite a big difference between the boys and the girls with the connected words but with the random words there is a smaller difference which indicates that they are closely matched. As there are no outliers in my results the mean shows central tendency well and from it you can make conclusions about how well each group did and compare results.
Median
The median is the value of the middle value when all the data items are ranked in order. If there are n items of data then the median is the value of the n+1 th item.
2
If n is odd then there is a middle value and this is the median, but if n is even there will be two middle values. In this case the you have to find the mean of the two middle values.
The results I got for median are as follows:
Male Connected
Med = 11
Male Unconnected
Med = 7
Female Connected
Med = 9.5
Female Unconnected
Med = 7
The median value is good if there are outliers in the data as they ignore them and simply choose the middle value, therefore they give a good representation of data with outliers. As you can see in the unconnected wordlist both males and females scored the same median value. This may tell us that both males and females have the same ability with unconnected words whereas males are slightly better at the connected words.
Mode
The mode is the value that occurs most frequently. If two non-adjacent values occur more often than the rest the distribution is said to be bimodal, even if the frequencies are not the same for both modes.
For a small set of discrete data, such as mine, the mode can often be misleading, especially if there are many values the data can take. The mode is used when the most probable or most frequently occurring value is of interest. Because of this the mode is not very appropriate for what I am doing.
Another way to analyse the data is to measure spread.
Measures of Spread
Measuring the spread of data gives you an idea of how far each part of data was from the rest. There are may methods of finding the spread of data, including: range, mean absolute deviation, the variance and standard deviation. It is a useful way of comparing the consistency of data.
Range
The simplest measure of spread is the range. This is just the difference between the upper extreme and the lower extreme.
Range = Largest - Smallest
Male Connected Words
Range = 8
Male Unconnected Words
Range = 6
Female Connected Words
Range = 8
Female Unconnected Words
Range = 5
The range is not always very effective as it only uses the extreme values. An example of where there range is useful is in quality control as it is sensitive to something going wrong on the production line. From the range you can see that males and female have the same spread of data for connected words whereas there is a slightly smaller range for females with unconnected words.
The Mean Absolute Deviation
A more useful way of measuring spread is to use deviations. A deviations is how far an item strays from a typical value. The deviation is simply each item minus the mean for the data group ( x - x ). To find a summary you must combine the deviations but added together the deviation equal zero as the same amount of deviations will be smaller than the mean as the amount that will be greater. The mean absolute deviation ignores the signs of the deviations and adds together the absolute deviations. The symbol |d| tells you to take the positive, or absolute, value of d.
The mean absolute deviation is the sum of the absolute deviations divided by the number of deviations.
∑ ⎢x - x ⎢
n
Male Connected Words
Mad = 1.645
Male Unconnected Words
Mad = 1.046
Female Connected Words
Mad = 1.884
Female Unconnected Words
Mad = 1.361
The mean absolute deviation shows a better representation of spread compared to the range. As you can see there is a larger spread of data with females and connected words than for the males this shows that there were more people scoring away from the mean.
The Variance and Standard Deviation
An alternative to ignoring the signs is to square the deviations. When this is done it is called the variance.
To find the variance of a data set:
-
Square the deviations ( x - x )2
-
Sum the squared deviations ∑( x - x )2
-
Find their mean ∑( x - x )2
n
Male Connected Words
Var = 4.495
Male Unconnected Words
Var = 1.899
Female Connected Words
Var = 5.821
Female Unconnected Words
Var = 2.472
From the variance you can calculate the standard deviation square rooting the variance. It is square rooted to get a more useful value because where the variance squares the numbers the square root of the standard deviation counteracts this.
_________
sd = √∑( x - x )2
n
Male Connected
sd = 2.120
Male Unconnected
sd = 1.378
Female Connected
sd = 2.413
Female Unconnected
sd = 1.572
From the deviance’s and standard deviation you can see that the boys are more consistent as there is a smaller standard deviation.
Evaluation
If I were to the same experiment again I think that I would do it a little differently. I think that I got a little to much data and it took quite a time to process it and collect it. Also I think that I should have had a time limit for people to recall the data as some people didn’t try as hard and maybe if given a time limit would have remembered more words.
I think also that the words I chose for the random ones were not suitable as many of them were connected such as; window and door, computer and calculator, and if the person picked up on this were able to recall more words due to their connectivity. Also another way of modifying this experiment is to do the same wordlist with boys and girls in different schools as this will give a greater scope for investigation.