Month Of Birth
The Gender
Hair Colour
Favourite Colour
Average Number of hours of TV Watched per a week
Stats Results
Eye Colour
Favourite Band
And many more…….
From this data I will make a theory and I will try and prove it by creating graphs and diagrams.
The hypothesis of this Question that I want to use the data from the Mayfield High School to prove that pupils born in March have a higher Intelligence Quotient (IQ) than people not born in March.
I will begin by taking a random sample of 30 Pupils born in March and 30 Pupils not born in March from the booklet and record there Date of Birth and IQ number. I will get these random people by doing a stratified sample.
To get my data and graphs I am going to sort and filter data from the key Stage 4 information. I am going to sort firstly by Birth Date in ascending order. I will then take a random sample 30 from each and put these into Categories, which I can then turn into 3 graphs:
· An average IQ of people born in March vs. An average IQ of people not born in March
· Cumulative Frequency of People Born in March IQ,
· Cumulative Frequency of People not Born in March IQ.
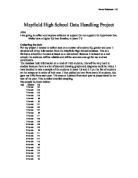
The Data
Pupils Born In March
Pupils **NOT** Born In March
26, 35, 56, 63, 85, 89, 97, 120, 122, 142, 147, 154, 156, 166, 173, 191, 193, 204, 209, 236, 237, 239, 240, 243, 283, 297, 306, 318, 327, 328
From sorting and filtering out my necessary data, I started forming percentages and stats.