GCSE Math's Statistics Coursework Introduction: I have been given a database which contains information about one hundred different used cars
GCSE Math's Statistics Coursework Introduction: I have been given a database which contains information about one hundred different used cars. We are investigating what is the most influential factor when buying a second hand car. The factors which I will be using are the age and mileage of the cars to see how they affect the price. Hypothesis: Cars which are older and have got more mileage are generally cheaper, but if I have a vintage (antique) car it will change my graph so it would skew my data as an outlier. Also some cars will depreciate quicker than others in their first year. Plan: Using the data which has been given to me I will compare age to mileage on a scatter graph with price. If I did the investigation by hand I would have chosen a sample of 100 cars of about 20 being picked at random using every 5th car as a sample and picking where to start counting at random by putting the numbers lets say the numbers 1-5 in a hat and pulling one out at random, But however I have been given the data on excel. By doing the charts on excel I will be able to plot all the data on the scatter graph and then draw a line of best fit (trendline) more easily and then compare between age and mileage because the computer can generate a graph much quicker than if done by hand. This will show me what sort of correlation the graph has, whether positive or negative and how strong it

CAR SALES MATHS COURSEWORK
CAR SALES MATHS COURSEWORK For my maths/statistics coursework I am to analyse a set of data given to me. The purpose of this investigation is to distinguish any possible correlation between certain variables. Furthermore, I must determine what factors affect the price of a car. From my data I am looking at particular variables as I feel these variables will the most subsequent to the price. The variables I am going to investigate are as follows: * The age of the cars. * The mileage of cars. * The engine size. * The makes. * The cost of the car when new * The second price. Initially, I am going to find any obvious links between the above variables. Moreover after finding the link's I will develop the data in an attempt to locate the influential links that affect the price of the car. To assist me in doing this I am going to draw graphs and obtain conclusions that will lead me on to finding a general formula. Out of the data given to me I have used the random function on my calculator to generate random number with which I was able to collect the cars I hope to analyse. Out of 100 cars I have chosen 36. I feel that 36 are a sufficient number to get the best possible conclusion. These are the following cars I am going to analyse: Car no. Make Price when new Second hand price Age Mileage Engine size Peugeot 8300 2000 7 65000 .4 2 Vauxhall 8700 500 9
Statistics on car prices
PLAN KAREL KUMAR 11S MATHS STATISTICS COURSEWORK For my maths coursework I will be conducting an investigation into statistics. I had a choice for this coursework of both statistics on year 10 to 11 school children, and facts about them and also their likes in terms of sport and subjects at school. I chose not to do this project on that information; instead I chose data on 100 different cars, the reason for this is that I like cars more and may perhaps pursue it as a career. I did not want to do a project on data that I have no interest in. The 100 different cars have data under the following headings, Car number in order from 1 to 100, the make of the car, the price when new of the car, the current second hand price, the age of the car, the colour of the car, engine size e.g. 2 litres, the type of fuel the car uses e.g. diesel or unleaded, the MPG (miles per gallon) this is roughly how many miles the car can travel at a constant speed on one gallon of fuel, the current mileage of the second hand car, if it has a service history or not, the number of previous owners, the length of the current MOT (road tax) if there is one, the TAX months, its insurance groups (this relates to the prices the owner will have to pay to insure the car, e.g. a high insurance group costs more money to insure), the number of doors (including the boot door), the style of
The aim of this coursework is to find out what affects the price of a second hand car.
Maths Coursework: Data Handling. By Gurpreet Bhamra. 11W1 AIM: The aim of this coursework is to find out what affects the price of a second hand car INTRODUCTION: In this investigation I have been given a set of data of 100 cars, from which I have to investigate the factors that affect a second hand car. The data includes information such as; model, make, colour, mileage, number of previous owners, etc... From this data I will only use 30% of it, and I will put I a certain amount of cars from my own research so I have a fair representation of the population. The 30% can be chosen by two methods, either by Stratified sampling (which is when the population is divided into categories, and then a random sample is taken from each category. The size of the sample is in proportion to the size of the data, as in if there is 10 cars in a group, at least 30% will be chosen so its fair). Another method is by Systematic Sampling, which is when a regular pattern is used in choosing the sample. The initial point is randomly chosen and then the nth term selected thereafter. Another method is by random Sampling, which can be done using a calculator or by putting values into a hat or bucket and picking at random. On the calculator, it can be done by pressing, "shift" "ran#" and "=". The value given will have to be rounded off to either 1 or 2 decimal places. In this coursework I will use
Gerald Ford President Ford was born on July 14th, 1913, in Omaha, Nebraska. He was born to Dorothy Gardner King and Leslie King. Their marriage ended a short time later.
Gerald Ford President Ford was born on July 14th, 1913, in Omaha, Nebraska. He was born to Dorothy Gardner King and Leslie King. Their marriage ended a short time later. When his mother remarried a man by the name of Gerald R. Ford she legally changed her sons name from Leslie Lynch King to Gerald R. Ford. President Ford had three half brothers all younger than him. Their names were Thomas, Richard, and James. When the Fords needed more room than they had in their other house they moved into a three-story house. Gerald Ford quickly became friends with kids in the neighborhood. Two of his friend's names were Arthur and Benjamin. They went to Madison school together, but when they went to high school, they were at different schools and didn't see much of one another. Another one of Gerald Ford's friends was Byrd Garel. Garel dropped out of high school and out of Gerald Ford's life when they were sophomores. After finishing high school he went on to college at Michigan State. Gerald Ford could not afford to pay for college, so they gave him a scholarship. He also found a job waiting on tables, and his aunt and uncle promised him two dollars a week. Ford was on the school football team and was one of the stars. Ford graduated from Michigan State in the spring of 1935. Although he had classes in various subjects with good grades it was his talent in football that got him
Gary’s Car Sales - Mathematics Coursework
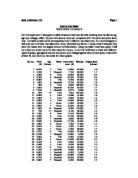
Josh Anderson 11S Page 1 Gary's Car Sales Mathematics Coursework For this experiment I was given a table of second hand cars for sale showing how the factors eg. age and mileage, effect the cost of a second hand car, compared with the same cars price when new. The table consists of 36 cars separated into 5 different manufacturers. For my investigation I will only use 3 of these manufacturers, Ford, Vauxhall, and Rover. I chose these 3 because they were the makes with the largest amount of information. Using the table I have been given I will try to find out which car is the best value for money. To do this I will have to draw two different types of graph, age against second hand price, and mileage against second hand price, draw a line of best fit, and work out formulas for these graphs. Car no. Price Age Make Cost when Mileage Engine Size (£) (Years) new (£) (Litres) 6,970 3 Ford 1,600 24,000 .6 2 3,350 7 Peugeot 7,100 85,000 .1 3 3,995 6 Ford 3,800 52,000 2.0 4 5,300 6 Vauxhall 6,300 70,000 2.0 5 6,500 3 Fiat 8,700 24,000 .2 6 ,500 9 Vauxhall 8,700 82,000 .6 7 995 9 Ford 8,500 02,000 .8 8 3,000 7 Vauxhall 0,400 63,000 .7 9 7,495 Vauxhall 9,770 8,000 .4 0 850 0 Ford 7,540 24,000 .6 1 5,595 4 Ford 1,000 41,000 .6 2 4,995 3 Ford 9,880 34,000 .4 3 5,595 4 Ford 4,000 55,000
My task for this coursework was to analyse the data given to me to see what effects the price of a second hand car; I tested such ideas like, age, service history and M.P.G.
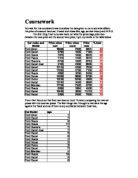
Coursework My task for this coursework was to analyse the data given to me to see what effects the price of a second hand car; I tested such ideas like, age, service history and M.P.G. The first thing I had to do was work out what the percentage price loss between the new price and the second hand price, I put my results in the table below. Car make and Model Price when new Price when used Price loss % loss Ford Orion 6000 7999 8001 50 Ford Escort 8785 595 7190 82 Ford Fiesta 7875 050 6825 86 Ford Fiesta 7310 495 5815 81 Ford Fiesta lx 8748 995 6753 77 Ford Escort duet 9105 2300 6805 75 Ford Escort 2125 4295 7830 65 Ford Escort 1800 4700 7100 60 Ford Fiesta 8680 3200 5480 63 Ford Focus 4505 8800 5705 39 Ford Puma 3230 8250 4980 38 Ford Escort 3183 3495 9688 73 Ford Mondeo 7780 7995 9785 55 Ford Fiesta 6590 664 4926 75 Ford Escort 5405 3995 1410 74 Ford Escort 9995 2995 7000 70 From this I found out that Ford cars lose so much % when comparing the new car prices with the used car prices. The first things that I thought to test were the age against the %lost and see if there is any correlation between these two, Car Model age Ford Orion Ford Escort 7 Ford Fiesta 8 Ford Fiesta 1 Ford Fiesta lx 7 Ford Escort duet 7 Ford Escort 5 Ford Escort 5 Ford Fiesta 4 Ford Focus 2

Ford’s Pricing Strategy.
Ford's Pricing Strategy. Background Ford Motor Company may be the world's No. 1auto makers, but they seem to have run out of gas in Europe. They are steadily losing market share and are marginally profitable at best. Ford showed just how bad things were on February 18th when it launched a drastic restructuring programme. This resulted in layoffs and plant closings, the company also slashed its European production capacity by up to 25%--or 525,000 cars a year. Fords Aim We are a global, diverse family with a proud heritage passionately committed to providing outstanding products and services that improve people's lives. Our Values. The customer is number one. We do the right thing for our people, our environment and our society. By improving everything we do, we provide superior returns to our shareholders. Problems within company The American giants have a lot of catching up to do, as most Europeans want cars that are small, stylish, and affordable. In a market that includes 27 carmakers, they have plenty of choices. And although Europeans bought a record 16.5 million cars and trucks last year, that was still 3.5 million units below production capacity. In that cut-throat environment, not everyone is going to survive. Adam Opel's subcompact $10,000 Corsa and Ford's $12,000 Fiesta, while small and affordable, lack the seductive styling of offerings from

In my investigation I will be trying to find out the average loss of money from 1st hand, to 2nd hand as the age of the car go up.
Introduction In my investigation I will be trying to find out the average loss of money from 1st hand, to 2nd hand as the age of the car go up. What I will do to find this out is to firstly separate them into colour and the cars which have the same number I will be looking at. When I find the most popular car I will be looking at it more closely to see how the prices of the cars change. I was given with a sheet of paper with lots of different pieces of data on such as car prices when new and second hand the mileage how old the car was what colour it was and also the make of the car. What I had too do is only look at two or three things and I had too look at the closely and I would had to compare something to another thing or why something changes. Like when you do more miles in the car the car price goes down and I would have to find an explanation for that. Aims Here I am going to be looking at the different sorts of colours of cars. What I wasn't to find out is which colour is the most popular out of all of them. My survey will be out of 100 because there are one hundred cars in my survey All my data will showed in a tally and pie chart. The colours that are in my tally are black, red, white, blue, green, marine, white, silver, nightfire, grey, aubergine, purple, cuirass, tourmaline, burgundy and gold. Hypothesis In this experiment I will think that you will get

in this investigation I will examine what factors affect how a second hand car is priced
Introduction: The aim of this investigation is to establish what factors are taken into concern when pricing a second hand car. My hypothesis on this investigation is based on my acquaintance of cars and its factor's that may influence its price. My prediction is that the mileage of a car can affect the price of it second hand. This is because the more the car has travelled in its owner's use the more likely the price of what the car is worth decreases. Another of my calculation is that age would influence the price; this is because that the elder a car gets the more its decreases in price. Also, the engine size would affect the price because the more the car has been through the more it is used, diminishing its value. Therefore in this investigation I will examine what factors affect how a second hand car is priced. For this first I shall first sort my data into two groups. One of which will be the popular make of a car, and the second the popular colour of a car. After grouping the cars, I shall show the results using pie charts because it will show the grouping clearly. After grouping the data I will use random selection to avoid being biased and also to let me know of which cars am I going to evaluate. Random sampling in statistical terms is a set of items that have been drawn from a population in such a way that each time an item was selected; every item in the