
Handling data Used car prices
Introduction The overall aim of this project is to find out what the major influences are affecting the price of a second hand car. There are some major influences directly affecting the price, i.e. the age of the car, the number of miles done by the car since its production and the number of modern features the car has. In this project I will be looking at the age and the mileage and how they affect the price of a second hand car. Aims . Assess whether there is a link between the percentage of depreciation in the value of the car from new to second-hand and the age of it and its mileage. My first aim is to find out how the 2 biggest influences affect the value of it when bought second hand. The percentage of depreciation in the value of the car is affected by many other factors; however, here I am trying to find out how the age and mileage alone affects it. The first two hypotheses stated below will help me investigate this objective. 2. Investigate what style of car has the largest depreciation value. This aim is different from the first one because it now looks at how the style of the car affects the depreciation value. I will be looking at hatchbacks, saloons and others (coupes, utilities and azuras) as part of this investigation. From this I will be able to see which style of car causes the largest drop in price, regardless of the age and the miles done by the

Used Cards - find which factors will influence the price of a second hand car and in what way
Maths Statistics - Used Cars Pilot Study Aim The aim of the coursework is to find which factors will influence the price of a second hand car and in what way. I believe that the price second hand cars are sold at is dependant upon several factors; certain factors will have a much larger effect on the price than others. In my investigation I am going to chose the two most popular (this being the most amount of a specific make provided by Edexcel of two specific makes) manufacturers of cars from a tally chart of all of the cars because the thing that people look at first when they are buying a car is the make and I believe this is what will affect the second hand price also. Different makes have different prices and depreciate every year at different rate resulting in sum cars holding their value due to the make. In addition certain cars have a very good reputation of being reliable while others are not. Also some cars have a higher social status than others for example people would prefer a Mercedes over a Ford. Before I commenced with developing a hypothesis, I firstly explored and tried to discover any data, information or details needed for my statistic coursework. Previous to this, I was given a candidate sheet that provided me with factors which I may have liked to consider. The factors are: * Price * Age * Mileage * Cost when new * Engine size * Colour *
Data Handling: Used car prices.
Maths Coursework Data Handling: Used car prices Introduction The aim of the coursework is to find which factors will influence the price of a second hand car and in what way. I have been given a large list of cars from my teacher with many different factors about them. I believe that the price second hand cars are sold at is dependant upon several factors, certain factors will have a much larger effect on the price than others. I my investigation I am going to chose the 3 most popular manufacturers of cars from a tally chart of all of the cars because the thing that people look at first when they are buying a car is the make and I believe this is will affect the second hand price the most. Certain cars have a very good reputation of being reliable while others are not. Also some cars have a higher social status than others for example people would prefer a Porsche over a Ford. I will also investigate the price depreciation, age and mileage that has been done So the factors that I will investigate in my coursework are * Make or manufacturer * Mileage * Age I will not investigate any of the other factors because I think that they will not have a large impact on the second hand price of a car for example colour is not very important to the price of the car because cars are made in lots of different colours and sold at the same price, the only reason the colour would

Maths - statistical driving test
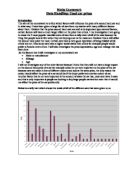
For this piece of coursework I have been given details from a local driving school. The details fall under four headings, these are gender, number of 1hour lessons, number of minor mistakes and instructor. My aim is to use this data to further investigate by creating hypothesis, using the data to prove or disprove my theories. Before deciding on what to investigate I need to look at the breakdown of the collected data, I will then use this information to decide on my investigation topics. Total data = 240 students. Instructor A B C D Total Male 29 49 18 20 116 Female 31 51 22 20 124 No of students 60 100 40 40 240 Overall in this table there is no gender basis as the male/female split is roughly 50/50. The instructor with the most students is B with 100 students, and the instructor with the least students is C/D with forty students each. Also each instructor has roughly 50/50 male and female split in students. From the breakdown of the data in the table I am able to identify three investigations. T help me in these investigations I will use a spreadsheet to do all calculations and graphs. My first graphs show the breakdown of data Graph 1 The pie chart clearly shows the breakdown of instructors and students. B has the most students, followed by A, with C and D having the same amount of students. Graph 2 Graph 2, the bar chart shows the

My task for this coursework is to statistically analyse the data given to me regarding Gary's used car sales.
My task for this coursework is to statistically analyse the data given to me regarding Gary's used car sales. I shall begin with looking at the data. The following data was given to me. No. Price Price when New Age Make Mileage Engine Size £6,970 £11,600 3 Ford 24,000 .6 2 £3,350 £7,100 7 Peugeot 85,000 .1 3 £3,995 £13,800 6 Ford 52,000 2.0 4 £5,300 £16,300 6 Vauxhall 70,000 2.0 5 £6,500 £8,700 3 Fiat 24,000 .2 6 £1,500 £8,700 9 Vauxhall 82,000 .6 7 £995 £8,500 9 Ford 02,000 .8 8 £3,000 £10,400 7 Vauxhall 63,000 .7 9 £7,495 £9,770 Vauxhall 8,000 .4 0 £850 £7,540 0 Ford 24,000 .6 1 £5,595 £11,000 4 Ford 41,000 .6 2 £4,995 £9,880 3 Ford 34,000 .4 3 £5,595 £14,000 4 Ford 55,000 .6 4 £4,995 £11,500 4 Rover 40,000 .4 5 £2,600 £12,000 7 Rover 82,000 .6 6 £1,000 £6,200 0 Peugeot 19,000 .1 7 £750 £5,100 1 Peugeot 96,000 .0 8 £1,350 £9,140 8 Ford 08,000 .6 9 £2,950 £17,750 8 Ford 96,000 2.9 20 £3,250 £9,990 7 Vauxhall 86,000 .6 21 £5,650 £11,150 3 Vauxhall 34,000 .6 22 £4,600 £7,300 2 Rover 7,000 .1 23 £5,400 £7,300 Rover 1,000 .1 24 £4,800 £7,300 Rover 26,000 .1 25 £2,700 £13,000 5 Fiat 51,000 2.0 26 £11,000 £13,800 Peugeot 9,000 .8 27 £2,800

The aim of this coursework is to find out what the different factors are that affect the value and price of different cars
Statistics Coursework: Used Car Sales Aim: The aim of this coursework is to find out what the different factors are that affect the value and price of different cars. Hypothesis: Different things affect the prices of second hand cars. The age of the car affects the price because if it is older then the engine and tyres etc. will be worn out. Also the mileage of a car will also decrease the price because of the same reasons. The higher the mileage the more the car has been used. The size of the car engine will increase the price because the bigger the engine the faster the car will go. More money is usually paid for this feature. I think that an old car will be low in price but the make of the car could possibly change and make it higher or lower because more is paid for some makes of cars. So different makes of car will affect all of my graphs. If they do then they will probably be removed in the summary of data or in the outliers. Cars that have extras, like air-conditioning, airbags and central locking etc., will probably cost more because they appeal to more people and more is paid for extra features. However older cars are less likely to include these features so the price will decrease more. The make of car could also influence the price because people pay different amounts for various makes of cars. The three variables I have chosen to analyse are the age, the

Maths Data Handaling
ZAKWAN AHMED 11A 2065 DATA HANDLING MATHS COURSEWORK MR UDDIN Introduction In this investigation I would looking at what factors affect the price of a second hand car. The things that I think that affect the price of a second hand car are: Mileage (The car might be warn out by all the journeys that It went through) Engine Size (How fast a car travels and the size of the engine) I have decided to follow the following line of enquiry, the difference between the mileage and the price and how it affects it. My Hypothesis is The higher the mileage the higher the price drops I would look at the price drop by using the following %drop in price = Price when new- 2nd hand price Price when new Planning ) First I am going to randomly select 30 cars from the data sheet 2) For each car I will collect the mileage and the cost of the car when it was new and the price of the car when it's not brand new. 3) I will draw a scatter graph (Mileage Vs % Price Drop 4) Then I will comment on my scatter graph to see if my hypothesis is correct. 5) What kind of correlation do I expect to find Quantity Car Number Price When New Second Hand Price Mileage Percentges drop 9 £13,176.00 £6,999.00 41000 47 2 0 £13,510.00 £7,499.00 27000 44 3 5 £8,601.00 £3,995.00 31000 54 4 8 £6,004.00 £1,995.00 20000 67 5 9 £13,586.00 £3,795.00
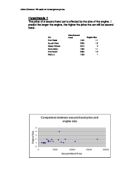
The price of a second hand car is affected by the size of the engine. I predict the larger the engine, the higher the price the car will be second hand.
Hypothesis 1 The price of a second hand car is affected by the size of the engine. I predict the larger the engine, the higher the price the car will be second hand. Car Price Second Hand Engine Size Mercedes A140 Classic 0999 .4 Mitsubishi Carisma GDI 5999 .8 Fiat Bravo 3495 .4 Fiat Cinquecento 995 0.9 Ford Fiesta 050 .1 Citroen Debut 495 0.95 Ford Fiesta LX 995 .1 Nissan Micra 595 .1 Daewoo Lanos 4395 .4 Lexus LS400 6250 4 Fiat Bravo 6795 .2 Peugeot 206 7500 .1 Mercedes Elegance 7500 2 Suzuki Vitara 2995 .6 Ford Mondeo 7995 2 Nissan Primera 2574 2 Peugeot 306 3995 .9 Rover Metro 995 .1 Ford Escort 2995 .3 Fiat Uno 495 From the results of my scatter graph, I can prove my hypothesis to be correct. The graph has a slight positive correlation, showing that as the engine size gets bigger, so does the second hand price. The line of best fit is a method of sharing the general rule for the relationship of engine size and price as a straight line showing that there is a slight positive correlation. However, although this is the case the relationship between them is not directly proportional, that is to say that engine size and price will not increase at the same rate. This can be deduced by the fact the line of best fit doesn't pass through the origin. I used a scatter graph to find this out as it is an easy and

Maths Data Handling-Secondhand Car
Second Hand Car Sales Introduction: When selling a car, there are many factors that will affect the price of the car including: Age, Mileage, Condition, Model, Engine size, Colour, Interior, Original Cost, Previous owners, Fuel/Petrol type, installed systems (e.g. Safety systems, sound systems, central locking), Air conditioning, Insurance, Tax and MOT, Number of seats, Type of Transmission, Miles per Gallon and Service History. I shall use only cars which are 2nd hand in my coursework because as soon as the car has been used the value instantly loses the VAT and becomes 2nd hand. Plan: I shall look at Scatter Graphs for Price against Age, Price against Colour, Price against engine Size and Percentage depreciation against age. I shall also try to refine my graphs and where possible use secondary sources, I shall also look at the Percentage depreciation per year of certain models. I shall work out formulas for my trend lines, describe correlations and compare graphs where it is relevant. If I were to do these by hand I would select maybe 10 from my sample but because I have access to the spreadsheet, I can easily use all 100. Hypothesis: I think that the graph of Price against Age will have Negative Correlation because as the car grows older, the lower the price should be with the exception of classic cars. I expect there to be no Correlation for the Price against

Maths Coursework:Used Cars
Introduction: In this coursework I will be investigating the most popular cars and factors that may have an effect on the price of the second hand cars. I will investigate the following factors: * Age of the car * Mileage * Engine size * New price Aim: My aim is to see if the above factors affect the second hand price and if they affect the popularity of the cars. Hypothesis: * As the mileage increases the second hand price will decrease. * The bigger the engine size the higher the price of the second hand car. * The older the car the cheaper it will be. I will be using scatter diagrams to show the correlation. I will also use box and whiskers to show the median and compare the ranges of second hand price. I expect all four hypotheses to be correct because logically if the mileage increases the price of the car should automatically decrease. It is the same for the rest of the hypotheses. Audi Bentley BMW 2 Citroen 3 Daewoo 3 Fiat 0 Ford 6 Honda Hyundai 2 Landrover Lexus Mazda Mercedes 3 Nissan 2 Peugeot 6 Porsche Renault 5 Rolls Royce Rover 2 Seat Suzuki Toyota Vauxhall 3 Volkswagen 7 Now I will do stratified sample to find the 4 most popular cars. I am using this method because it is fair and unbiased. Using this pie chart I have decided that the four most popular cars are Vauxhall, fiat, ford and rover. This is because