Case Analysis - The Ford Pinto
Week 4 - Case Analysis - The Ford Pinto - By: Michelle Hingtgen Legal Case Analysis Facts: The American Automobile industry has historically been tied to the nations economic cycle in which three or four years were good followed by one or two poor years. In 1977 there were four major U.S. automakers including General Motors, Ford, Chrysler and American Motors. Imports were starting to make their presence in the market because they offered subcompact cars at reasonable prices. Ford started producing the Ford Pinto on August 10, 1970. Ford accelerated the planning process and achieved the design and development time in 38 months, compared to the industry average of 43 months. Ford wanted the car to weigh less than 2,000 pounds and cost less than $2,000. The only Pinto that was first sold was a two-door sedan. The hatchback model and station wagon model followed in later years. They also converted one of its assembly plants from full-size to compact cars in 51 days to help produce many more compact and subcompact cars, which were overtaking the market. Ford had conducted many tests related to the Ford Pinto's fuel system. An early question was where to safely put the gas tank. They decided to keep the tank in the original location behind the rear axel even though it was determined that above the axel would have been safer. Ford had an internal objective of a 20 mph standard

What Influence Did Henry Ford Have On 1920s America?
Simon Addison What Influence Did Henry Ford Have On 1920s America? Henry Ford was born in Dearborn, Michigan on July 30th, 1863. His family were farmers, but from a young age Ford was driven by ideas of the American Dream and industrialisation, and so left school at 16 and moved to Detroit to become a machinist's apprentice. During his time as a mechanical engineer he became interested in the idea of automobiles, and by 1893, after much experimentation, he completed his first motorcar. In 1903, Ford founded his own company, the Ford Motor Company at Highland Park in Detroit (which would later become known as "motor city"). By 1908, Ford was producing 100 cars a day by basic mass-production methods used in many industries. Ford had teams of 12 men, each attaching a part to a car in order to make a finished model. Ford had released a new model of car, the Model T, but believed his current production methods were inefficient, and wanted a new system to go along with the new car. Even by 1913, when Ford was producing 500 cars a day, each car took 121/2 hours to make. He had to hire workers who were semi-skilled, or at least trained in many areas of car production, and so was forced to pay them higher wages than he would have liked. He also thought that too much time was wasted with workers moving around to do different jobs. In 1913, Ford visited the factory of Swift and Co., a
Use given secondary information to investigate what influences the price of a second hand car.
Aim My aim for this investigation is to use given secondary information and to investigate what influences the price of a second hand car. Hypothesis Does the engine size of the different cars throughout my data have an effect on the cars price? Does the age of any car have an effect on the car's price? Would the amount of mileage done on specific cars have an effect on their price? Prediction Factor 1 I predict that the engine size of the car will have an effect on the cars price because the bigger the engine then the greater the price depreciation will be over a certain period of time. Factor 2 I also predict that as the mileage increases on the car the second hand price will decrease. Generally as time moves on, the mileage will increase, and the cars with the most mileage will depreciate more in price than the cars with less mileage. Factor 3 The age of the car I also feel will have an influence on the car's price, obviously if the car is older the price depreciation will be higher, if the car is newer the price depreciation will be lower. Plan Out of 100 cars that were given to me, I'd randomly select 36 cars. I'd select 36 because than later when the pie charts would need to be drawn it would be easier to work out the angles. There may be a need to research extra data if there is need to make the investigation fair, accurate and not bias. After

The aim of this investigation is to find out what influences the price of second hand cars.
MATHEMATICS COURSEWORK: Statistical data Use the information to investigate what influences the price of a second hand car Aim The aim of this investigation is to find out what influences the price of second hand cars. (used cars) Introduction Hypothesis The sample provided, includes a list of 100 cars that shows quantitative and qualitative data, such as Second Hand Price, Engine Size and Colour. To obtain my hypothesis, I carried out research in a car magazine called 'LOOT' and a website: www.autotrader.co.uk From this I found out that the most common cars reflected my sample and this was also a good indication of cars on the current market today. The magazine and website research gave me quantitative results. Therefore, my hypothesis and what I will investigate from this is: "The older the car in age and the more owners it has, the more cheaply the second hand price value is going to be." Also, I take into consideration that, "The less mileage the car has, the better condition and more expensive the car is. This more mileage the car has, the more likely chance of it being a cheap, second hand car." I chosen this as my hypothesis because, in reality that is what determines the price of car, For example, If a new car in age had a lot of owners, it would vary the second hand price of the car. This is compared to a the same car, but with fewer owners, it

My maths coursework is based on a spreadsheet with information about cars. I am going to study the data and answer the question - In general does the age of second hand cars affect the price?
GCSE Maths Coursework - Statistics My maths coursework is based on a spreadsheet with information about cars. I am going to study the data and answer the following questions: - * In general does the age of second hand cars affect the price? * Does the mileage of second hand cars affect the price? * Does the size of the engine on second hand cars affect the price? * The average cost of Vauxhall cars compared to Ford cars. In general does the age of second hand cars affect the price? Plan I am going to find out whether the age of second hand cars affects the price. I am going to use all the data in the spreadsheet as there are only a hundred pieces. This will make my results as accurate as possible. Firstly I am going to separate the age and price columns from the rest of the spreadsheet. Then I will sort the data into age groups and take the average of each group. The averages of each age group will be then put into a table and on a line of best fit. I am going to use the averages because this is the best way to display the data. All of the data from each category (Make of car) will be used to work out the averages, as there isn't enough data in each category to take a sample. Collecting, Processing and Representing I have collected the required data and sorted it into tables. All the cars which are 1 year old are shown below. I have worked out the

Examine how the age of a second hand car affects its price. Also to check if there is any relationship with the age and price drop.
Investigation: To examine how the age of a second hand car affects its price. Also to check if there is any relationship with the age and price drop. Hypothesis: Although naturally there will be some exceptions I believe that in most cases, as the age increases, the price of a 2nd hand car will decrease. This is clearly shown if you divide the old price by the price when new. Method: I have created a frequency table to firstly sort out my sample size. I will divide the frequencies by 5 to give me a final sample size of 20 from the original sample of 100. I will divide each individual frequency by 5 to determine how many of each age is needed for a fair sample. This is the Frequency table of the sample size of 100. Age Frequency 0 2 8 3 8 4 2 5 7 6 7 7 9 8 0 9 5 0 3 1 2 0 3 0 4 0 5 For my investigations I need a sample size of 20 so I have divided each frequency by 5. This will tell me how many of each age is needed for a fair investigation. Age Frequency Ratio to sample (Frequency divided by 5) Rounded up 0 2 2 2 8 .6 2 3 8 .6 2 4 2 2.4 2 5 7 .4 6 7 3.4 3 7 9 3.8 4 8 0 2 2 9 5 0 3 0.6 1 0.2 0 2 0 0 0 3 0 0 0 4 0 0 0 5 0.2 0 00 20 Now that I know how many of each age is needed. I will choose these cars at complete random. Paying attention to the age, I will manually search the age
I am going to analyse the given data from a used car sales person to see whether we can find out the price of the cars to sell in the garage.
Brief- I am going to analyse the given data from a used car sales person to see whether we can find out the price of the cars to sell in the garage. Hypothesis - There are different factors in the data. However certain factors affect the price more than others, for example; the age, mileage and the size of the engine. Age is important because the older it is the least it will cost. The bigger the engine size, the more it will cost and the more mileage it uses up, the least it will cost. I am now going to analyse the piece of data by doing random sampling. I think that this is the best type of method because it is easier and faster, also because it is fairer. I will do this by choosing every odd numbered car. To compare the original price between the mileage, engine size and age, I am going to do three scatter diagrams. Then I will compare the three correlations. I expect that the mileage will be a negative correlation, the engine size will be positive and the age will be a negative correlation. After that, I am going to circle the outliers in red in each of the three graphs then I will re-do the graphs again but without the outliers been in them. I am also going to try and find equations for the three graphs using this equation, y = mx+c. mx represents the gradient and c represents the y intercept. Finally I will aim to do an average for the three (according to the
Ford Motor Company
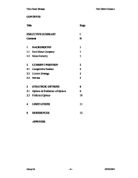
CONTENTS Title Page EXECUTIVE SUMMARY i Contents ii BACKGROUND 1 .1 Ford Motor Company 1 .2 Motor Industry 1 2 CURRENT POSITION 2 2.1 Competitive Position 2 2.2 Current Strategy 3 2.3 Metrics 5 3 STRATEGIC OPTIONS 6 3.1 Options & Evaluation of Options 6 3.2 Preferred Options 10 4 LIMITATIONS 11 5 REFERENCES 12 APPENDIX BACKGROUND .1 Ford Motor Company Ford was the pioneer of the motor vehicle. The Ford Model T earned inventor Henry Ford a place in history and with it the foundation on which he, along with 11 others, based the Ford Motor Company. Today, Ford Motor Company is a family of automotive brands consisting of: Ford, Lincoln, Mercury, Mazda, Jaguar, Land Rover, Aston Martin, and Volvo, employing 350,321 (Yahoo Finance) workers in more than 200 countries. .2 Motor Industry The American oligopoly in the motor industry, consisting of Ford, General Motors and Chrysler, has suffered from poor financial results recently. As reported by www.guardian.co.uk (16/06/03), "the big three US car-makers are wrestling with the combined effects of over-capacity, growing competition from Europe (such as BMW) and Japan (such as Toyota), huge pension and health care costs, and a damaging increase in incentives to get customers into the showrooms and the prospects of slumping sales". A real sign that the car industry was in the midst of
Objective; to investigate the relationship between used car price and age of car.
30/6/03 Mathematics Coursework C+H/WK Objective; to investigate the relationship between used car price and age of car. Equipment; to do this task I will need the following equipment; Ruler, Pencil, Pen, Multimedia computer (to write up investigation in neat), And plenty of A4 paper. My Hypothesis; Since all the cars from the given data base are MODERN cars, I predict that they ONLY decrease in value once they are bought. It would be different for really old CLASSICS as they can be so old that they actually increase in their value as they age. This is because; . The demand of these cars rises as few are left available, from being scraped. 2. Since theses cars lack modern technology of galvanised metal, they suffer from rust, thus people selling them in mint condition spent thousands of pounds restoring the car to it's original condition, hence they want that money back when they come to sell it. 3. The cars are different from modern cars, and give the owner a high status through being so immensely unique. Because all these cars in the database are all modern, the cars should, in my prediction decrease in value as they age and those that are guaranteed to become classics may depreciate slower in value than those that aren't. Also those of luxury and
I have been given instructions to collect data for my GCSE statistics coursework and then to represent them by interpreting them using graphs and attributes, which I think influence the prices of a second hand car.
STATISTICS COURSWORK year 10 I have been given instructions to collect data for my GCSE statistics coursework and then to represent them by interpreting them using graphs and attributes, which I think influence the prices of a second hand car. Below is my coursework flowchart that will show the steps I will take to complete my coursework. FLOWCHART HYPOTHESIS I think that the age, make, amount of owners will affect the price of the second hand cars. In the investigation, I will use several different types of charts and graphs to support and show my hypothesis is correct and to show if my predictions were incorrect, or correct. After I have investigated some of the attributes, I will then draw up another hypothesis and see what will happen at the second half of my investigation. I think that if things do change, the tax amount and mileage may affect the price. DATA COLLECTION There are many types of data, to obtain it we must observe and measure something. This is known as a variable, there are two types of variables: -Quantitative variables, which have NUMERICAL observations or measurements. -Qualitative variables, which have NON NUMBERICAL observations or measurements. The other types of data I may consider using are Continuous data which are measured on a scale and can take any value on that scale Discrete data which is concerned with a number of countable