
To find out what affects the prices of used cars - I will be looking at the two different variables age and mileage to find out if they effect the prices of used cars.
Aim To find out what affects the prices of used cars. I will be looking at the two different variables age and mileage to find out if they effect the prices of used cars. Hypothesis I think that the mileage has a lot to do with the price of cars and I feel there will be a lot of positive correlation because in my experience of cars the higher the mileage the lower the price. As the mileage, increase the price decrease. Also I believe that the cars age will have more effect than the mileage on the price because as the average age for car increase the price decrease. I think that this is because if the car is old or it has a high mileage then it is more likely to need service. Method My first part of investigating was to look at the data sheet. Then think of the way I would do the sampling I had three different ways in which I could have done my sampling in stratified, which is a sample in which the population randomly sampled. Anther one is random sampling which is choosing sample at random Lastly, selective sampling which is a selective sample is one which every nth term is chosen where n is chosen at random. I considered all three, I chose selective sampling because it s the easiest, and would see a pattern more easily, I chose the every fourth car on the data sheet and looking at the age and mileage price. Than I put all my selective data in a table and found out

My maths coursework is based on a spreadsheet with information about cars.
GCSE Maths Coursework - Statistics My maths coursework is based on a spreadsheet with information about cars. I am going to study the data and answer the following questions: - * In general does the age of second hand cars affect the price? * Does the mileage of second hand cars affect the price? * Does the size of the engine on second hand cars affect the price? * The average cost of Vauxhall cars compared to Ford cars. In general does the age of second hand cars affect the price? Plan I am going to find out whether the age of second hand cars affects the price. I am going to use all the data in the spreadsheet as there are only a hundred pieces. This will make my results as accurate as possible. Firstly I am going to separate the age and price columns from the rest of the spreadsheet. Then I will sort the data into age groups and take the average of each group. The averages of each age group will be then put into a table and on a line of best fit. I am going to use the averages because this is the best way to display the data. All of the data from each category (Make of car) will be used to work out the averages, as there isn't enough data in each category to take a sample. Collecting, Processing and Representing I have collected the required data and sorted it into tables. All the cars which are 1 year old are shown below. I have worked out the
A Comparison Between Car Adverts
Media Coursework A Comparison Between Car Adverts Advertising is simply the promotion of products, although advertising dates back to Roman times, it is only recently that it has been becoming more sophisticated. It can reach us anywhere and with the advance of the Internet into our society, soon no one will escape junk e-mails. For this essay I am comparing two car adverts; they are both advertising the Vauxhall dealer A A Clark and they are both from local papers, but there are many differences also. One of them is a large, colourful, A4 size advert from the Bracknell News, (subject A) and the other is a half of a page, in colour, far more formal and from the free paper the Bracknell Standard (subject B). My first impressions of subject B were that while it's not particularly eye catching, it's brief, to the point, and makes the cars sound (and look) good. Subject A is really eye catching and shows off a lot of cars, but I feel that it's over enthusiastic. They both have the same shade of red for their borders; B has bold arrows of this colour going out to each of the cars, on which there is info about that car. While A also has some bold red writing. I think this works equally well in both ads, on the whole being in colour they appear bright and interesting in the black and white paper. A is especially bright and different with a 'kids' font style and wobbly

Calculating Used car prices
Table: Car Number Price When New Current Price Age (years) Percentage Loss 6000 7999 50 23 8785 595 7 82 33 7310 050 8 86 35 7875 495 1 81 43 8748 995 7 77 45 9105 2300 7 75 52 2125 4295 3 65 53 1800 4700 5 60 57 8680 3200 4 63 64 4505 8800 2 39 65 3230 8250 3 38 80 3183 3495 7 73 81 7780 7995 4 55 86 6590 664 0 75 96 5405 3995 5 74 99 9995 2995 6 70 Graph: Equation of Line of Best Fit: Y= 4.2x + 43 Y= mx + c Y=mx + 43 Gradient= Y/X = 37/8.9 = 4.2 (1.d.p) Y= 4.2x + 43 E.g.: Assume a car is 6 years old. How much is its current price if the car was bought new for £10,000? %age loss = 4.2 x 6 +43 = 68% money lost = 68% of 10,000 = £6,800 new value = 10,000 - 6,800 = £1,500 Mean of Graph: Age (years) Percentage Loss 50 7 82 8 86 1 81 7 77 7 75 3 65 5 60 4 63 2 39 3 38 7 73 4 55 0 75 5 74 6 70 5.625 66.4375 MEAN Table: Car Number Price When New Current Price Mileage x 1000 Percentage Loss 6000 7999 7 50 23 8785 595 63 82 33 7310 050 90 86 35 7875 495 74 81 43 8748 995 80 77 45 9105 2300 84 75 52 2125 4295 29 65 53 1800 4700 34 60 57 8680 3200 27 63 64 4505 8800 7.2 39 65 3230 8250 34 38 80 3183 3495 43 73 81 7780 7995 30 55 86 6590 664 37 75 96 5405 3995 57 74
I have been asked to investigate factors that affect the depreciation of cars.
I have been asked to investigate factors that affect the depreciation of cars. To do this I would ideally like to collect my own data about used cars. This would be called primary data. I would have collected data on the make, model, mileage, engine size, age, price and price when new of several hundred used cars. Unfortunately this would have taken a lot of time, but the advantage would have been that it would have been reliable data which I could trust, and I could have found out exactly the information that I wanted. It would have been impossible for me to do such a large survey, however, so I had to use secondary data that I got from the CCEA website. The advantage of this was that it was quick, cheap and easy, but I can't be sure of the accuracy of these results and I don't know if any bias was involved when it was being collected. I have also found that many of the results are incomplete. From the very start, I am sure that two of these results are wrong - a Renault Laguna which costs £50,000, and a Renault Clio that increases in value. I have deleted these results straight away. Hypothesis 1 My first hypothesis is that cars depreciate more as they get older. I used the spreadsheet on the computer to test this hypothesis, but first I had to get the age and percentage depreciation for each car, neither of which are recorded in the table. Firstly, to get the

I predict that all the cars that I have chosen at random will have similar attributes, but in detail they will be completely different and therefore not comparable.
Mathematics Statistics Coursework Winter 2002 - Used Car Prices Introduction: I am going to investigate what influences prices of second hand cars, and look into how car prices depreciate and what causes this. I am examining 55 randomly chosen cars taken from the supplied list and from 'Auto Trader' magazine, which I supplied. I am going to examine the relationship in the sample between the age, mileage and price. I am going to narrow down the in 3 stages from all cars to only 1998 Ford Fiestas. From this, I will draw the conclusions from the examination about how the price decreases and what affects this. Section 1 - Random Cars Hypothesis 1: I predict that all the cars that I have chosen at random will have similar attributes, but in detail they will be completely different and therefore not comparable. I predict: * The older a car is, the more miles it would have been driven. * The more miles it has been driven, the less it costs. * As the vehicle ages, it will be worth less. Data Collection 1: I have chosen to use the make and model of each car, because that is vital to know what car is being bought/sold or examined. I also chose the year it was first registered, because I want to prove that the older a car is, the more miles it will have been driven. So the mileage is important too. Little things could be used too, but I think that it is not worth including
maths=Data Handling Coursework
Data Handling Coursework: User Car Database Hypothesis: The more the mileage of a car the lower the used price of the car. I will use different makes of cars and the choices I have picked are Mercedes, Ford and BMW; however I think that because of my knowledge I know that the Mercedes is a more expensive make of a car and therefore it should have a higher used price than the rest of the cars. The reason for this hypothesis is that I think that the higher the mileage of a car the lower the used price of the car so if a car has used up a high mileage that would mean that that the quality of the engine for example would be low and that would mean that the used price would much low. I want to then find out knowing that the Mercedes is much more of an expensive make than the Ford and BMW, so if the mileage has been used up for the Mercedes and the ford and the BMW will the Mercedes still be expensive. The information that I will need to collect to find out if my Hypothesis is right or wrong: ==> Make of the car so Mercedes, BMW or Ford ==> The 'Used Price,' of the car ==> The 'Mileage,' of the car I can find this information from a database which is a Secondary data Source, as the information in the database is from Nower Hill High School. The Pros and Cons of using a secondary database are: Pros: ==> The data is there for you, so you don't need to spend time and collect

How Does the Ford Motor Company Deal With Their Responsabilty To Care For the Enviroment?
HOW DOES THE FORD MOTOR COMPANY DEAL WITH THEIR RESPONSABILTY TO CARE FOR THE ENVIROMENT? Introduction For this unit of the business studies course we need to study how a certain company affects the world that we live in. I have chose the Ford Motor Company (Ford). The reason for this is, ford produce cars and are responsible for the cars performance and for the recycling of waste materials and emissions from factories. Car companies affect the environment directly as the products they produce/build pollute the atmosphere so I felt that this would be a good company to investigate. Ford owns a number of other car corporations such as Lincoln, Mercury, Mazda, Volvo, Jaguar and Land Rover. Obviously I can not conduct research into every different franchise but ford say that they have the same policies for every area of their company. Ford have a number of different approaches which they follow to help to care for the environment. Hypothesis I intend to research using the Internet and newspapers how Ford care for the environment and what approaches they follow and if they are similar to other companies in the same sector. Having never looked into this certain subject before I cannot be sure what techniques car companies adapt to help maintain the environment and stop pollution to the atmosphere. I would expect to find that they have developed different fuels, which produce

Money Management - Buying a Car.
Jaimes Charles Citizenship Coursework Money Management Buying a Car Section A. F or my first piece of coursework in 'Money management' I have been given the task of buying an expensive item. To help me decide which item would be the best for me, I brainstormed with other pupils a list of suitable items and here are the results. * Holiday * House * House extension/renovations * Car * Boat * Caravan * House abroad (holiday home) * Landscape garden I have chosen a car as my item because as I am I my final year of school, I would like to learn how to drive and eventually buy a car. So this piece of coursework will act as good background information for when that time comes. The list below shows some of the things I will consider when going to buy a car. * Age of the car * Car type (model) * Price * Tax * Insurance * How to pay * Petrol or diesel * Used or brand new * Manual or automatic Section B - Methods of enquiry. Method 1 The most popular car on the road. (a) To find out what the most popular car is I will give out a questionnaire and make a tally sheet. The most frequent car that appears in my survey will be the one I will tally from the most popular to the most unpopular. The reason I will be doing this is to find out what the general public is thinking. Prices of the most popular car brought in a car showroom. (b) I am going to phone up
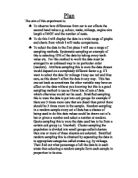
The aim of this experiment is: To observe how differences from car to car effects the second hand value e.g. colour, make, mileage, engine size length of MOT and the number of seats.
Plan The aim of this experiment is: * To observe how differences from car to car effects the second hand value e.g. colour, make, mileage, engine size length of MOT and the number of seats. * To do this I will display the data in a wide range of graphs and charts from which I will make comparisons. * To select the data in the first place I will use a range of sampling methods. Systematic sampling an example of this is selecting 10% of the data by taking every tenth value etc. For this method to work the data must be arranged in an unbiased way in no particular order (random). Attribute sampling this is were the data chosen would depend on a completely different factor e.g. if I want to select the data for mileage I may use red and blue cars, as this doesn't affect the data in any way. This has one set back as sometimes the other variable may have an effect on the data without you knowing but this is a good sampling method to use as I have lots of sets of data which otherwise would not be used. Stratified sampling this is were the data is put into sub groups for example if there are 3 times more cars that are diesel than petrol there should be 3 times more in the sample. Random sampling in a random sample every set of data has a chance of being used to do this data values could be drawn out of a hat or given a number and select a number at random. Quota sampling