Who is the more dangerous of the species!
Who is the more dangerous of the species! Deep in the deserts of Nevada, on the outskirts of (Las Vegas), there lives a species of arachnid...poisonous, deadly, and feared by many...the black widow spider. So called because the female eats the male after the mating ritual, hence becoming a 'widow'. No prizes for guessing who wears the trousers in this couple, but what about man----sorry, I mean HUMANkind?! Who is the more dangerous of the species? I am sure you are all wondering what the answer to this is; indeed, you wouldn't be the first! People have been deliberating, cogitating and trying to digest the solution to this highly controversial issue for centuries. I would like to begin by mentioning some fascinating statistics. There are more females to males in the world with 51.3% of the world's population being female. The % of males is rapidly (and when I say, rapidly, I mean in evolutionary terms) declining. Worried, well we should be! It has been said that the Y-chromosome is deteriorating slowly but, unfortunately, steadily. The way things are going, we may be faced with a situation where men will become extinct. And no women will not, die a natural death because there's nobody left to nag! Then how is the human race meant to continue? Even this question has been answered. It is possible for two women to have a child. All that needs to be done is to fuse two eggs

From the data I have received I have chosen to conduct an investigation comparing height and weight because I feel there much relevance between ones and height and weight.
Mathematics Coursework In this investigation, I have been given data from Mayfield School. From the data I have received I have chosen to conduct an investigation comparing height and weight because I feel there much relevance between ones and height and weight. I have chosen to compare height and weight because I feel I will get clear results and therefore conduct a meaningful and knowledgeable investigation. I will be trying to determine whether ones height has any relevance to ones weight and then I will attempt to find out whether separating boys from girls will show different trends and in general have much difference from the group as a whole. I will first investigate heights and weight for year 7 and for year 11 and as an extension I will make comparisons and comment for both years. For my investigation I will need to start with a random sample of 50 students (25 girls, 25 boys) from year 7. I have data from a total of around 170 students, and the amount of boys and girls are roughly even, hence meaning there are about 85 boys and 85 girls. To get a completely unbiased sample of students I will be using random selection. I have figured out that because there are around 85 boys it will be sensible to choose every third boy in the list starting with the third boy down the list. Theoretically this will mean that around 10 students will not even be considered at
Dead Weight Perssure Tester
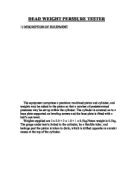
DEAD WEIGHT PERSSURE TESTER ) DESCRIPTION OF EOUIPMENT The equipment comprises a precision machined piston and cylinder, and weights may be added to the piston so that a number of predetermined pressures may be set up within the cylinder. The cylinder is screwed on to a base plate supported on leveling screws and the base plate is fitted with a bull's eye level. Weights supplied are 2 x 2.0 + 2 x 1.0 + 1 x 0.5kg.Piston weight is 0.5kg. The gauge under test is linked to the cylinder, by a flexible tube ; and leakage past the piston is taken to drain, which is drilled opposite an annular recess at the top of the cylinder. 2) THEORY Pressure generated by the piston and weights is equal to force exerted on the cylinder device by the piston area. P = pressure kg/cm² or other unit F = force kg or other unit A = ? D² 4 = piston cross section area =250mm² =2.5cm² Exact diameter of the piston is indicated on the piston. This pressure P is transmitted to the pressure gauge and comparison between actual pressure and gauge reading can then be made. 3) TEST PROCEDURE a) Firstly, placing the pressure gauge on the tester and ensure that the connection is tight. Besides that, the adjustment screw for the leveling must continuously. b) Let the cylinder filled with water until over floor and taken " zero" pressure gauge reading. c) Insert
Investigate the factors that affect the bounce of a tennis ball.
Tennis ball investigation Aim: Investigate the factors that affect the bounce of a tennis ball. Key factors (variables): ) Height of drop 2) Surface of bounce 3) Gravitational pull 4) Room temperature/ball temperature 5) Weight of ball 6) Material of ball 7) Brand of ball 8) Age/wear of ball 9) Size of ball 0) Force of drop/push How the key factors will affect the bounce: ) The higher the drop the higher the bounce 2) The harder the surface the higher the bounce 3) The weaker the gravitational force the higher the bounce 4) The warmer the ball the higher the bounce 5) The lighter the ball the higher the bounce 6) Discontinual-unknown 7) Discontinual-unknown 8) The newer the ball the higher the bounce 9) The smaller the ball the higher the bounce 0) The more force put into the drop/push the higher the bounce I have chosen to investigate 1) Height of drop. Prediction I believe that the higher the height the ball is dropped from the higher the bounce, because when the ball is lifted the higher it is lifted the more energy is needed to lift it. Therefore more energy is converted from chemical potential energy in the body, to kinetic energy when the ball is being lifted, to gravitational potential energy (G.P.E) when the ball has been lifted to the height of the drop. The more G.P.E the
Anorexia Nervosa and Bulimia Nervosa
Anorexia Nervosa and Bulimia Nervosa People who suffer from anorexia nervosa try to lose weight by starvation, whereas those suffering from bulimia nervosa often binge eat (overeat) followed by purging themselves of what they have just consumed in order to maintain a constant weight. The age range from the two illnesses differ slightly, with those suffering from bulimia nervosa being of the age range, 16-40, and the majority of those suffering from anorexia nervosa being diagnosed between the ages of 13-18. The age range in obviously more varied in bulimia, though that is not to say that there are not cases of anorexia in a more diverse age group. In addition, the consequences of the two conditions affect different factors of the individual. Studies have found anorexia being the main cause of considerable amounts of reduced grey matter in weight-recovered patients. Anorexia patients are also more likely to die from starvation, suicide or organ malfunction than Bulimics. With bulimics, the continued effects of self-purging causes kidney damage, irregular heartbeat, disease resulting from vitamin and mineral loss and many other injuries to the body's health. Holland et al (1984) Holland et al set out to find a genetic link in those who suffered from anorexia nervosa by using twins. Twins, a natural and perfectly normal occurrence, are an extremely good means to research
Can Rip-Rap Protect StartBay In A Major Storm?
Section 3 - Can Rip-Rap Protect Start Bay In A Major Storm? Rip-Rap is basically a type of sea defence. It comprises of large boulders lined up at the top of the beach, which are designed to stop the energy of the waves from getting right to the top of the beach and further. They are type of natural sea defence in that they have not been man-made, just placed by man. However, they can't just be any old boulder from anywhere, they have to be the right size and shape or they will be virtually useless. We went to the beach at Beesands Village to measure some of the Rip-Rap that had been placed there to try and stop the waves and tides from eroding the coastline even more than it already had been. Again, split into groups, we were asked to measure 3 of the rocks in the Rip-Rap wall, and collate the measurements of these. They were height, length, and width. My group tried to find 3 boulders that were of a different shape and size to the others, so that we could see if the boulders were good enough and heavy enough to be effective defence. The equipment we used to collect the measurements was just a tape measure. There were several limitations on the way we collected the results, and these may have affected the final results we collected to see if the Rip-Rap was effective. The results we collected from the 3 boulders are displayed in the table below: Boulder Number: Length
Introduction (Statistical investigation) The aim of this statistical investigation is to find the relationship between height and weight in year 11's. The investigation will include a comparison between boy's and girls.
Yr11 STASTTICAL COURSEWORK Introduction (Statistical investigation) The aim of this statistical investigation is to . Find the relationship between height and weight in year 11's. The investigation will include a comparison between boy's and girls. Collection Data I have chosen year 11 students which contains 25 boys and 25 girls from the Mayfield High School data set. I have token a random sample from the year 11 data set. I have done this by choosing every 2nd male and every 2nd female. This has bought the sample size down to 12 boys and 12 girls. BOYS GIRLS Boys Height (M) Boys Weight(KG) Girls Height (M) Girls Weight (KG) .71 57 .83 60 .8 60 .6 54 .32 45 .62 56 .62 56 .62 54 .78 67 .65 42 .61 47 .68 47 .68 50 .72 60 .65 54 .62 51 .8 72 .58 54 .8 72 .65 54 .73 60 .03 45 .81 54 .55 50 .68 63 .62 48 .68 63 .68 50 .83 75 .63 48 .67 70 .56 45 .64 60 .63 38 .97 84 .58 48 .52 38 .68 47 .84 78 .56 38 .76 62 .5 45 .57 54 .7 54 .61 42 .69 50 .73 50 .65 48 .78 37 .67 48 Here is my sample of 25 boys and 25 girls. Boys height (M) Boys Weight (KG) Girls height(M) Girls Wieght(KG) .8 60 .6 54 .62 56 .62 54 .61 47 .68 47 .65 54 .62 51 .8 72 .65 54 .81 54 .55 50 .68 63 .68 50 .67 70 .56 45 .97 84

Student Data Project.
Maths Coursework 2 Ryan Tadd My 2nd project in maths is to find the average student for years 7-11 in Mayfield High School, I have been given a spreadsheet with precisely 1183 students each with the following information about themselves written in on it: Year Group Surname Forename Age in months and Years Gender Hair Colour Eye Colour Left or Right handed IQ Height (m) Weight (Kg) Distance they live from school Means of travel to school Number of Siblings Numbers of Pets English SAT level Math SAT level Science SAT level Favourite things I plan to brake the project into 2 sections, the first part I will focus on finding the average for the quantitative data (numerical), this is likely to be the easier of the 2 sections and will take up little time. The second part will be trying to find the average for the qualitative data (Non-numerical) this is the data with the no numbers just word, e.g. Forename or Left or Right handed. This will be hard to find averages for and I think I may not be able to find an average for some. But I will see what I can do. Before I start either section I must get a sample of the data because it will take forever to do a average of all 1183. To make a sure that the sample is as fair as possible and I don't select people because I like the name or because they like the same things as me I will need to take a random Stratified
height and weight of mayfield school
Height and weight of pupils at Mayfield high school Introduction In this coursework I am going to investigate the relationship of weight between boys and girls, in year 7 to year 11. I am going to check whether gender and how old you are affects the result. As a result from these result's I will compare all the results together and see if my hypothesis is correct. In regard to this the way in which I will test to see that my hypothesis is correct is by first making a pilot test, by randomly selecting number's of all four year's then finally putting all my grouped data together and transforming it into a cumulative frequency table. Hypothesis: However from this I am now going to focus on the weight of boys and girls. In order to get a result this will determine if my prediction was true. I am going to investigate to see whether: * The older you are the more you weigh in year 7 and year 11 ( girls and boys) * I think that boys will weigh more than girls in year 7 and year 11 The reason for me to have such aims and prediction is because I want to be able to challenge those who think the opposite, by gathering my research results, and hoping that my prediction will be correct. The reason why I have predicted that the older you are the more you will weigh is because in reality from what I have seen from my own experience, and noticed is that as people tend to get older (
An eating disorder is a serious disruption of a persons eating habits, it some cases it may be a reflection of abnormal psycho
An eating disorder is a serious disruption of a persons eating habits, in some cases it may be a reflection of abnormal psychological functioning. The two most common eating disorders are, anorexia nervosa, and bulimia nervosa. Both of these eating disorders are most common among adolescent girls, but they do occur amongst older people and are becoming more and more frequent amongst men. Also they were originally only found in European countries but are becoming more common all over the world. Anorexia nervosa This is a disorder where the person fears that they might become overweight. (despite being seriously underweight) therefore they engage in self starving to try to prevent this from happening. Bulimia nervosa This is a disorder in which the person will engage in episodes of uncontrollable eating "bingeing" which is then followed by self indulged vomiting, "purging". People who have bulimia have abnormal concerns with body size and a morbid fear of being or becoming fat. Characteristics of anorexia There are four listed criteria for anorexia Anxiety This is a key characteristic of anorexia. The anxiety associated with the disorder and the excessive fear of becoming fat. People who have anorexia not only become obsessed with weight but they also become fearful of weight gain. Weight Weight loss has become to be considered abnormal when it drops below 85% of