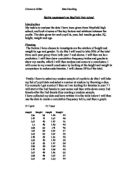
The factors I have chosen to investigate are the relation of height and weight to age and gender
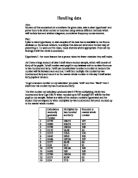
Maths coursework on Mayfield high school Introduction My task is to analyse the data I have been given from Mayfield high school, and look at some of the key factors and relations between the pupils. The data given for each pupil is, year, ks3 results gender, IQ, height, weight and age. Planning The factors I have chosen to investigate are the relation of height and weight to age and gender. To do this I will need to take 50% of the total from each year group from both year 7 and eleven. I will then make a prediction. I will then draw cumulative frequency tables and graphs to show my results, which I will then analyse and come to a conclusion. I will come to my overall conclusion by looking at the height and weight in comparison to males ands females. I will choose 50% of the total. Firstly I have to select my random sample of pupils to do this I will take my list of pupil data and select a number at random by throwing a dice. For example I get number 2 then as I am looking for females in year 7 I will start at the 2nd female in year seven and then write down every 2nd female after the 2nd female thus creating a random sample. I have collected my data and have written it in the table below I will then use the data to create a cumulative frequency table, and then a graph. Yr 7 girls Yr 7 boys Height Weight Height Weight .56 53 .48 44 .42 41 .62 48 .62

"How does Angela Crater use linguistic andliterary techniques in 'The Bloody Chamber'?"
"How does Angela Crater use linguistic and literary techniques in 'The Bloody Chamber'?" In the postmodernist story "The Bloody Chamber" Angela Carter has revisited "Bluebeard", the folktale as recorded by the late seventeenth century author Charles Perrualt. This folktale about a wealthy French nobleman who marries and then kills his wives for being disobedient, as they enter the forbidden chamber, takes a turn as he himself is killed by his latest wife's brothers. Although Carter's retelling follows the original folktale in basic structure it is intended to disturb adding more vivid descriptions to the characters and setting, rasing sexual issues such as corrupt masculine desires. She also employs a more feminist viewpoint, in having a young virgin bride protagonist tell the story and in having her mother rescue her instead, in addition portraying the power struggle with relationships, and between males and females. Her interesting new viewpoint challenges the patriarchal system and is expressed through a range of linguistic and literary techniques, which establish morals as well as the themes of eroticism, innocence, pornography, disobedience and death. Carter uses a combination of conventions from the traditional fairy tale genre and the gothic romance genre to create a new dimension to the respective from of the "Bluebeard" folktale. The setting against a dark

Bouncing Ball.
Preliminary Work Variables The variables for this experiment are: - > Size of the ball > Mass of the ball > Surface Area of the ball > Pressure on the ball > Height the ball is dropped from > Temperature of the room > Temperature of the ball > Hardness of the ball > Material of the ball Prediction I am predicting that the higher that the ball is dropped from, the higher the ball will bounce back upwards, and this will be at a directly proportional rate. Background Knowledge The gravitational potential energy that the ball has before it is dropped is transferred into kinetic energy as the ball begins to fall. When the ball hits the floor, the kinetic energy is transferred into stored potential energy. The potential energy becomes kinetic energy as the ball starts to bounce back up. During the bouncing back up stage of the ball, energy is lost through heat and sound. The less the floor deforms and gives way, the less energy will be wasted as heat and sound because more energy remains stored inside the ball. Therefore, the harder the floor surface is, the higher the ball is likely to bounce. This is known as energy degradation. As the height the ball is dropped from decreases, the less energy there is in the ball so it bounces back less than when it was at a higher height. The acceleration due to gravity affects the rebound height of the ball. Some balls

Data Handling Project looking at a database based in Excel where there is data from Key Stage 3 and 4 from Mayfield High School
Introduction. This Data Handling Project is looking at a database based in Excel where there is data from Key Stage 3 and 4 from Mayfield High School. This data consists of several columns containing both Quantative and Qualitative Information. Examples of this data are: * Year Group * Name; Surname, Forename 1 and Forename 2 * Age in Months and Years * Month of Birthday * Gender * Hair Colour * Eye Colour * Left/Right Handed * Favourite Colour * Average number of Hours TV Watched per week * SATS Results etc... In this project I am going to make up several Hypothesises that I will use the data from the Data Base to help me prove. However I will not use all of the data, and for each Hypothesis I will Random Sample using the computer 30 entries which fit into certain restrictions applying to that Aim. The Random Sampling method that I am going to use is a computer generated one. The method of doing this is as follows: . Filter or sort the necessary data, copy and paste into a new sheet. Add 2 extra columns before this data. In Column 1 leave blank, and in Column 2 type the numbers 1 to X. 2. In the top of Column 2 type =RAND()*X, this makes a number between 1 and X. In the top of Column 1 put SUM in. In Column 1 next to that number put the number 1 and press enter, a new number will appear, put a 1 next to that number etc... The amount of 1's you have typed will

Mayfield High School Project
Mayfield High School Project Introduction Mayfield High School is a secondary school of 1183 pupils aged 11-16 years of age. There are 603 male pupils and 580 female pupils at this school. For my Data Handling Coursework, I will be investigating a line of enquiry from the pupils' data. Some of the options include the relationship between IQ and Key Stage 2 results, comparing hair colour and eye colour. However, I have chosen to investigate the relationship between height and weight. One of the main reasons being that this line of enquiry means that my data will be numerical, allowing me to produce a more detailed analysis rather than eye or hair colour where I would be quite limited as to what I can do. If I were to make an original prediction of my results, my hypothesis would be; "The taller the pupil, the heavier they will weigh." In this project I will consider the link between height and weight and will eventually be able to prove whether my original hypothesis is in fact correct. Other factors I am going to consider when performing this investigation, is the effect of age and gender in my results and I will make further hypothesize when I reach that stage in my project. Collecting Data I have originally decided to take a random sample of 30 girls and 30 boys; this will leave me with a total of 60 pupils. I have chosen to use this amount as I feel this will be an
Evaluate the given data, state a clear hypothesis' and prove them to be either correct or incorrect using various different methods which will include box and whisker diagrams, cumulative frequency curves etcetera.
Handling data Aim: My aim of this coursework is to evaluate the given data, state a clear hypothesis' and prove them to be either correct or incorrect using various different methods which will include box and whisker diagrams, cumulative frequency curves etcetera. Plan: I plan to state hypotheses, to take samples of the data that is available to me from a database on the school network, to analyse this data and determine the best way of presenting it. To work out the mean, mode etcetera where appropriate. From all my findings I will then write a conclusion. Hypothesis 1- the more lessons that a person takes the fewer mistakes they will make. As I have a large amount of data I shall take a random sample, which will consist of forty of the pupils. I shall number each pupil in my database with a number from one to two hundred and forty. I will use my calculator to select a number at random this number will lie between zero and one. I will then multiply this number by two hundred and forty and round it to the nearest whole number in this way I shall select forty pupils at random. To get a random number on my calculator you press 'shift' and then 'Ran#' then I shall time this number by two hundred and forty. The first number my calculator produced was 0.778 by multiplying this by two hundred and forty I get 186.72 when rounded up is 187 so pupil 187 will be the first
Investigating the relationship between height and weight for the pupils in a secondary school.
AS Level Statistics Project Investigating the relationship between height and weight for the pupils in a secondary school Table of Contents Introduction 3 Primary Data by Direct Observation 3 Secondary Data 3 Hypotheses 4 . Distribution 4 2. Comparative 4 Methods 4 Data Collection 4 Choosing the Data 4 Stratified Sampling 4 Randomised Selection 4 Analysis and Interpretation of Data 5 Data Summaries 5 Measures of Spread of Data 6 Box and Whisker Diagrams 6 Stem and leaf and Frequency Table (Boys Height) 7 Stem and leaf and Frequency Table (Girls Height) 8 Stem and leaf and Frequency Table (Boys Weight) 9 Stem and leaf and Frequency Table (Girls Weight) 10 Standard deviation and confidence intervals 11 Comparing heights against Weight for Boys 11 Correlation Analysis 11 Comparing heights against Weight for Girls 12 Correlation Analysis 12 Conclusions 13 Evaluation 13 Appendix 1 - The data 14 Introduction For this investigation, I am going to use data on secondary school pupils to find the distribution of the data and also to look for any meaningful relationships between the heights and weights of the students. When I was looking at the various things that I could study, one of the factors that I looked at was data collection. The amount of data was large, spanning across different year groups. I could have looked at the variation of weight and
Investigating the effects of increasing Gravitational Potential Energy on the speed of an object.
Investigating the effects of increasing Gravitational Potential Energy on the speed of an object. My aim of the experiment is to find whether if you raised the height of an object giving it more G.P.E the object's speed increases too. I will measure the speed using a ticker timer and will try and make it as much of a fair test as possible. The variables from this test are both dependant and independent. The independent variables can be changed as I have control over them but to make it a fair test I will be keeping them constant apart from one, this is because the one you change has a direct effect on the dependant. The dependant variables will change as they depend on the independents (as the name suggests). The independent variables are; the height of the ramp and the mass of the trolley (0.95 kg in my experiment), I will change the height of the ramp so the dependant will be affected giving me the results I need. The dependant is the speed of the trolley. During the experiment I will be measuring the speed of a trolley while it travels down different heights on the same ramp. I'll attach a piece of ticker tape attached to a ticker timer to record the speed. I will do this three times at three different heights to make my results as accurate as possible, I will take the three results and find the average time for each ramp. I predict that as I raise the ramp by x amount

I am going to investigate whether the radius of a circle affects the speed it travels at around the circumference.
Radius of a circle/speed traveling at I am going to investigate whether the radius of a circle affects the speed it travels at around the circumference. Method I will take a piece of string and attach a rubber bung to the end of it. I will string a small piece of copper tubing onto the string and attach a 100g weight to the opposite end to the bung. I will mark on my string 15 measurements, each being 5 cms apart, ranging from 5cm - 75cm. I will make the length of string from the bung to the copper tubing at the first mark; 5cms. I will then swing the rubber bung around for 10 revolutions; timing the length of time it takes with a stop-clock. I will record this time in a results table. The string will stay at 5cms long because of the weight attached to the other end and my control. The weight will prevent the string from sliding up and down in the tubing when doubled with my control when swinging the bung. I will repeat the above 3 times so ensure that my result is accurate. I will then repeat it a further 14 times, 3 times for each, for the rest of my measurements. My measurements are: 5cm, 10cm, 15cm, 20cm, 25cm, 30cm, 35cm, 40cm, 45cm, 50cm, 55cm, 60cm, 65cm, 70cm, 75cm After all of my results have been recorded I will then take a total average for the 3 times I have done each one and write that down in my results table also. Apparatus set up Prediction I predict
Studies on the shape of limpets at two different zones in a sheltered rocky shore.
Studies on the shape of limpets at two different zones in a sheltered rocky shore Aim The aim of this experiment is to investigate whether the exposure to wave action affects the limpet shell morphology and find the possible reasons for this. I am going to do this by looking at the height/width ratio of limpets at two different zones in a sheltered rocky shore. Introduction Limpets are dome-shaped molluscs with no spiralling of the shell. They have a distinctive, oval shaped shell with the peak more-or-less near the centre. After four years growth they can be 5 cm across at the base. They can live up to 15 years or so on the upper shore. Patella is the genus name for the most abundant group and is best known for its ability to cling onto rocks. The muscular foot and the secretion of a chemical allow the limpets to grab small imperfections in the rock surface and grasp very strongly. They can hold on to the rock with a force of 75 lbs/in2. Clamping down at low tide will prevent them from drying out. As limpets settle down they rotate the shell and grind it into rock, which produces a good fit but also, on death, leaves a scar on the rock surface. To breathe they remove oxygen from the water, which is drawn in to the gills via a hole above the head. When the tide goes out, they have a problem with the lack of water. However they clamp down and reduce their metabolism,