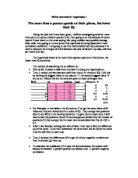
The more time a person spends on their phone, the lower their IQ.
Maths coursework: hypotheses 1 The more time a person spends on their phone, the lower their IQ. Using the data that I have been given, I will be investigating whether more time spent on a phone lowers a person's IQ. I am going to do this because of recent reports I have heard on the news saying that using mobiles may possibly damage brain cells. I am going to try and prove this hypothesis by using Spearman's rank correlation coefficient. I am going to use this mathematical technique because it is used to discover the strength of a link between two sets of data (in my case, call time per month and IQ). The hypothesis tested is the more time a person spends on their phone, the lower their IQ should be. The method of calculating the co efficient is: * First of all, I created a table from the data I'm doing my hypothesis on. * Then, I ranked my two data sets (call time/ month in mins and IQ). I did this by ranking the biggest value in my column '1', the second biggest value '2' and so on. Values that are the same are given a mean (average) rank. Rank IQ Call time Rank Difference d² 70 42 6 -5 25 2 79 17 4 -2 4 3 82 94 2 4 4.5 85 33 5 -0.5 0.25 4.5 85 12 2.5 2 4 6 89 12 2.5 3.5 2.25 49.5 For Example, in this table in the IQ column, I've got the same value of 85 twice and they are ranked fourth in order of IQ. They occupy two

I am going to investigate the IQ's and number of hours of TV watched a day of students between 11 and 16 years old.
PLAN I am going to investigate the IQ's and number of hours of TV watched a day of students between 11 and 16 years old. To do this I am going to use a spreadsheet of data about the pupils in a large school. The spreadsheet has all students in alphabetical order. As I want to see how IQ and number of hours of TV watched a day changes with age I will order the students by year groups and by gender. My Sample I have decided to look at years 7 and 11. I will take equal numbers of boys and girls in each year group so that I can compare boys' results with girls' results. I will use the method of random sampling so that everyone in the group has an equal chance of being selected and to remove any possibilities of bias. I want a total sample of 60, so I will take a sample of 15 boys and 15 girls from each year group to make 30 in each year. In year 7 there are 131 girls. I want a sample of 15. I will use a calculator to get my random numbers. I will read off 3 digit numbers until I have 15 different numbers between 001 and 131. These will give me my sample of girls. My random numbers are:- 051, 096, 025, 092, 129, 016, 128, 090, 085, 108, 131, 064, 089, 068, 057 Because there are 151 boys I cannot use the same set of numbers for the boys as it would not allow the last 20 students to be selected. Therefore I will get random numbers in the same way for the boys but until
The relationship between IQ and Key Stage 2 results
The relationship between IQ and Key Stage 2 results The aim: To compare the KS2 results with the IQ's to identify whether IQ will determine their results. Hypothesis: There are many different lines of enquiry, such as: * The variations in hair colour * The variations in eye colour * The relationship between hair and eye colour * Shoe sizes * The distance travelled to school * The relationship between shoe size and height * The relationship between height and weight * The relationship between Key Stage 2 and/or 3 results * The relationship between IQ and Key Stage results * The height to weight ratio in terms of body mass index I have chosen to investigate the relationship between IQ and Key Stage results. I believe that the higher the IQ, the higher the KS2 results. This is because IQ measures how intelligent a person is and key stage results reflect knowledge and retaining of information. I will try and prove this by comparing the average KS2 results, years 7 to 9, to their IQ's. The Data: I have collected some secondary data, and from it I must take a random sample of the information I need. I will do this by using my calculator. I have given each page a number, and then the names on that page also have numbers. I will then press 'shift' and then 'RAN#' on my calculator, and it will display a number between 0 and 1. I will then multiply this number by 34

What evidence is there in England and Wales for Global warming?
My question: What evidence is there in England and Wales for Global warming? My plan: Firstly I will attempt the question of 'What is global warming'?- looking at the causes of global warming and what factors affect global warming. I will then look at the pieces of data I have been given and choose which sets of data I will be using for my investigation of What evidence is there in England and Wales for Global warming? Also I will have a brief look at what other factors there are that I cannot get data for that could possibly affect global warming and its results. I will then state my two hypotheses. One will be concerning England and Wales and then my second will be comparing England and Wales to Northern Ireland and Scotland together. I will then start into my analysis. Here I will use Excel to create graphs using the data I have been given and use calculation methods and tools inside of Excel to calculate necessary numbers for comparing information concerning my two hypotheses. I will then draw up conclusions using my analysis with reference to my hypotheses. Lastly I will write an evaluation, writing how I felt the investigation went and what I would like to look into further if I had the opportunities. Firstly I must determine what is global warming in my case There is nothing as hot as the debate that has surrounded global warming. Most mainstream

isopometric quotients
Isoperimetric Quotients Isoperimetric Quotients of plane shapes are calculated using the formula: I.Q. = 4? x Area of shape (Perimeter of shape)² I am going to investigate isoperimetric quotients of plane shapes and interpret my findings. Firstly, I am going to look at flat shapes. Using the formula, I will calculate the isoperimetric quotients of the shapes. Starting with the smallest 2D shape- a triangle- I will calculate the I.Q s of right-angled triangles. I will also do this with isosceles and equilateral triangles. I will move on to quadrilaterals and look at the I.Q s. Maybe there will be something about the results that will help me with further plane shapes; pentagon, hexagon, heptagon, nonagon, decagon and possibly a circle. With comparison, the results might show something about the shapes, such as a pattern. Triangles I am now going to study right-angled triangles. Right-angled triangles I will first look at the 3, 4, 5 right-angled triangles and then enlargements of it. . Perimeter= 3+4+5= 12 cm Area= 1/2 x 4 x 3= 6cm² I.Q. = 4 x ? x 6 12² I.Q. = 0.5236 I will look at similar enlarged right-angled triangles, based on the 3, 4, 5 triangle. 2. Perimeter= 6+8+10= 24 cm Area= 1/2 x 6 x 8= 24 cm ² I.Q= 4 x ? x 24 24² I.Q. = 0.5236 3. Perimeter= 16+20+12=48 cm Area= 1/2 x 16 x 12= 96 cm² I.Q. = 4 x ? x 96 48² =0.5236 Similar
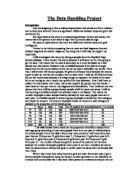
I am investigating to find a relationship between ks2 results and IQ in children and to determine whether there is a significant difference between boys and girl's ks2 results and IQ.
The Data Handling Project Introduction I am investigating to find a relationship between ks2 results and IQ in children and to determine whether there is a significant difference between boys and girl's ks2 results and IQ. My hypothesis is that there is a relationship between IQ and ks2 results, this means that is if a person's ks2 result is high their IQ should also be high. My second hypothesis is that there is a difference between boys and girls intelligence. I intend to do this by comparing them in stem and leaf diagrams, box and whisker diagrams and scatter diagrams. By doing this it will help me support my hypothesis. I will investigate this theory by taking a sample from the Mayfield High School database. I have chosen this source because it will save me the time going to get the data. This means that the data is secondary so it could be biased so I will discard any information I believe to be unreliable because if the data is strongly biased and out off the correlation of the rest of my data it will affect my results. From this, I will extract 100 random people, 50 girls and 50 boys this is because we need an equal number so that we can compare them to each other. I will use 50 Girls and boys IQ and ks2 total scores because it is a big enough to represent the whole of the data but is not too big so that it would use up all of the time allocated. First I will

Maths Coursework: investigation into the correlation between IQ and KS2 results
Maths Coursework: investigation into the correlation between IQ and KS2 results Aim: In this investigation I aim to investigate the correlation between IQ and the result obtained for KS2 result. This investigation will help to prove whether it is intelligence that affects the marks obtained in and examination, or if there is some other factor involved. If a conclusion is made, then education may be able to take a step further into improving the system, and helping children do better in examinations. I intend to work from a hypothesis, and by the end hopefully prove or disprove this hypothesis. Hypothesis: The hypothesis that I will be working from will be: "The higher the IQ level of an individual, the higher mark / level, that individual will get in KS2 examinations." Prediction: To either prove or disprove this hypothesis, I have been given a data set of around 1200 students (1183 to be exact), from Mayfield School. I predict that the higher the IQ, the higher the individual's score is likely to be, because their intelligence is higher, but that may also depend on another creative or artistic intelligence, for example, so this is not entirely a firm prediction, but it what I expect to happen. Plan/Method: The way I will catty out the investigation will be to sort out the data into year groups, work out their percentages in comparison to the total, and use the

Is there any relationship between IQ and Sat Results?
Maths Coursework The aim of this piece of coursework is to test these two hypotheses: . Is there any relationship between IQ and Sat Results? 2. Is there a difference between the development of IQ over time between boys and girls? To do this I will use the data collected from Mayfair High School. To test that my hypotheses were not too difficult to test and gave an outcome that I could show had correlation, I did a preliminary graph. This consisted of random Sat Results and IQ's taken from year 7 girls and boys. These graphs both came out with correlations, and so I proceeded with these hypotheses. There was a lot of data available, not all of which was useful to my study, and therefore I deleted any information I considered to be irrelevant, like height and weight of each of the people. I then ended up with just the relevant data I needed, which is: * Year Group * Gender * IQ * Sat Results I then decided to do a stratified sample, using 10% of my entire database. I did this because 10% of my entire data range will give me enough results to form a conclusion, and will also keep the numbers manageable. Using a stratified sample also ensured that I got the same proportions of each year group and the different genders, as in the entire database. Hence I proceeded to work out the proportions needed in my stratified sample as such: I decided to round any values I got

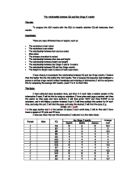
Hypothesis - On average, year nine students that watch more television per week have a higher IQ.
Maths Coursework Hypothesis 1 On average, year nine students that watch more television per week have a higher IQ. Girl Number IQ Hours per week watching television 23 96 0 hours 2 44 90 3 hours 3 9 01 4 hours 4 8 03 4 hours 5 21 05 9 hours 6 0 02 50 hours 7 20 04 9 hours 8 30 08 5 hours 9 50 00 4 hours 0 26 32 4 hours 1 09 00 5 hours 2 21 08 00 hours 3 23 28 28 hours 4 24 24 35 hours 5 13 02 6 hours 6 12 5 hours 7 5 02 35 hours 8 49 06 35 hours 9 52 07 20 hours 20 6 06 5 hours 21 54 02 32 hours 22 08 12 0 hours 23 87 07 22 hours 24 78 92 4 hours 25 62 91 8 hours 26 99 07 0 hours 27 77 89 20 hours 28 02 00 2 hours 29 01 08 25 hours 30 26 12 3 hours 31 22 97 0 hours 32 45 95 4 hours 33 48 02 35 hours 34 43 07 6 hours 35 27 94 2 hours 36 51 09 2 hours 37 53 05 32 hours 38 2 00 8 hours 39 35 00 2 hours 40 25 13 8 hours 41 55 06 3 hours 42 06 13 6 hours 43 07 08 25 hours 44 05 10 4 hours 45 9 06 20 hours 46 5 03 4 hours 47 56 94 3 hours 48 57 98 9 hours 49 69 00 20 hours 50 68 09 3 hours Boy Number IQ Hours per week watching television 86 09 7 hours 2 32 15 8 hours 3 38 90 4 hours 4 57 00 25 hours 5 60 06 4 hours 6 61 00 4 hours 7 62 04 7 hours 8

Are left-handed people more intelligent and creative than the right-handed in Mayfield High School?
:Bryan Yip 10R Maths Coursework Are left-handed people more intelligent and creative than the right-handed in Mayfield High School? In my coursework, I am going to focus on the IQ, Key Stage 2 results, favourite colour, favourite subject and height of students in Mayfield High School. Specify, I will concentrate on the Year 7,8 and 9 boys and girls because these year groups have closer relationship with the Key Stage 2 results. In the following coursework I am going to investigate: ) Do left-handed people have a higher IQ than the right-handed? 2) There is a correlation between the IQ and the Key Stage 2 results for the left-handed and the right handed. 3) Red colour always gives people the feeling of aggressive. Creative people often have new ideas and are willing to try, so more left-handed people like "red" than right-handed. 4) The subjects " Design & Technology", "Art" and "Music" always require creativity. More left-handed people like these subjects. Before selecting the data, I will stratify the data. Stratifying data can reflect all of the data in Mayfield College, Number of Boys Number of Girls Total Overall number of people in Mayfield College 414 398 812 % in school (cor. to the nearest integer) 50% 50% 00% Stratifying the number of right-handed in Year 7, 8 and 9 Number of Boys Number of Girls Total % of certain year of boys in the