My hypothesis is that people with siblings have a lower IQ than people without siblings. Also that people with lower IQ's have lower KS2 results.
Data Handling Task Matthew Moorhouse Hypothesis My hypothesis is that people with siblings have a lower IQ than people without siblings. Also that people with lower IQ's have lower KS2 results. IQ Levels Using all the pupils available for KS4, I made a scatter graph showing how many siblings a pupil has against their IQ. I saw several points, which were extreme so I deleted these from my graphs. At this point I looked for a line of best fit but the line was almost horizontal so it would have been of no use. After this I made a bar graph so I could see how many pupils had a given IQ. This showed a concentration of pupils around the 100 - 104 area. I produced several bar graphs so I could easily see any relation between sibling numbers and IQ. The sort of relation I was looking for was that pupils with no siblings had a higher IQ than those with lots of siblings. The number of pupils in certain sibling groups from KS4 was in some cases very low (11 in one case). I had to use KS3 pupils to the number to 90 so each graph was a fair comparison and the results would be more accurate. The last group of 6+ siblings only had 61 children in it. These pupils were important because my hypothesis needs input from this high group. The pupil count of this group was increased by 1/2 so there were 90 pupils in that group so they could be compared. These bar
Investigation to find any relationships between IQ and key stage 2 results.
Aim - To find any relationships between IQ and key stage 2 results. Hypotheses ) Students with a high IQ will achieve high mark in their key stage 2 results. 2) Students with a low IQ will achieve a low mark in the key stage 2 results 3) Girls will achieve an overall better result than boys in the key stage 2 result. 4) Girls will on average have a higher IQ level than the boys. The Data I will need 40 students to compare and examine in my investigation. To get these students I will randomly choose 20 boys and 20 girls. I have chosen 20 students from each gender because it makes the investigation fairer. I have chosen 40 students overall because it gives a wide range of results to analyse. To record the data I hope to use different tables, charts and graphs. I will use these charts and tables to draw conclusions and the relationship between the students IQ and key stage 2 results. Choosing Data To retrieve the data about the students I downloaded the information from the internet. To choose the data that I obtained, I will randomly pick 20 girls and 20 boys by circling their names and stating their IQ and key stage 2 results. Results I choose the following boys to examine - Name - IQ - key stage results for English , Maths and Science - Average key stage result . Stanley Adams - 94 - 3-3-4 - 3 2. Robbin Banks - 103 -

IQ Investigation
Mayfield High Maths Coursework I am investigating around data about a school called Mayfield High. Mayfield High is a database of secondary data and I will be using only the Key Stage 3 pieces of data. I am doing this investigation so that I can find links between different aspects of secondary school pupils, and create charts and graphs to show the patterns that I have found. I am going to look at a database on excel. I will then take a stratified sample of years 7, 8 and 9, depending on my sample size I have chosen to be 60 (because I think that it is a viable size). After I have worked out my stratified sample I will give each member of each year group a unique number and use random number tables to choose my final sample so that my sample is an unbiased one, giving no special interest to any specific data in particular. I believe that the more people watch TV, the lower their IQ should be. I also believe that the further people go up the school, the higher their IQ should be and that girls are generally cleverer than boys throughout Key Stage 3. I also believe that there may be a relationship between people's IQ and the amount of time they watch TV and that the relationship between IQ and TV shows a higher correlation as you move up the school. I will then perform a statistical analysis by investigating the areas using standard deviation, histograms, scatter diagrams
Predicted grades given by subject teachers at the time of Yellis.
?2 Aim The aim of this investigation is to see if the predicted grades given by subject teachers at the time of Yellis, has more correlation to grads achieved by students in there gsce's then there Yellis predictive grades Yellis is a test taken in year 9 of schooling; there are 2 parts to the test, a mathematic and vocabulary styles paper, each student has to complete in exam conditions. The subject teachers predicted grads are based on departmental meetings where all teachers of the student discuses the progress of the child. They take in to consideration the students natural ability, work rate in class, behaviour, quality of work, and test results, these aspect are taken over many weeks so a rounder picture is built up of the student of which a prediction can be based, Yellis only take in to account the mark achieved on the test, ranks the results all around the country, then assign grand to each percentage, eg top 20% are predicted A. The population that I will be sampling the data from, is Stoke Dameral community College, but there may be implication outside he given population, as the trend may be evident over the whole of the examined students, but I can't say that it will be just with data from the Stoke Dameral as there may be different methods of producing predicted grades. The reason that I have chosen stoke Dameral as the parent population is because the

In this investigation I am going to look into the number of goals scored against the league position in the 2002/03 season.
Goal In this investigation I am going to look into the number of goals scored against the league position in the 2002/03 season. I want to take 5 teams out of the league because this gives a variety data so it will be accurate. To get these teams I will use a random numbers devise and the numbers it says I will use the corresponding league position e.g. if it picks out number 5 I would use the team that came 5th in the league which was Liverpool. I am using this method because it is easy to use and it will give a cross-section of the league. That should help me get accurate data. When I used the random number devise. Which was 'ran#' button on my calculator. They results where as follows- Number Team Goals 6 Aston Villa 42 4 Chelsea 68 Man Utd 74 8 West Ham 42 9 Man City 47 To find out if there is a link between league position and goals I will use a line graph. My Prediction is that they will be a strong coloration between the two. I base this upon the fact to get higher in the league you need to get points which means winning games and to win games you need to score goals. Graph 1 shows a strong inverse correlation between goals and league position. So the lower (1st being the lowest and 20th being the highest) the league position the higher the amount of goals scored. I will now look to see weather the amount of goals scored against makes a

The 3 statements I am going to investigate are: -Does the gender of the student have an affect on their KS2 result in English?Do students who do well in Maths, also do well in Science?How does the IQ of the students affect their results?
Maths Coursework The Mayfield High School Project Introduction The task I have been set is to produce a project on Mayfield High School (fictitious), and to investigate the relationships between a number of variables like age, 1Q, weight, KS2 results etc. These aspects will be compared between 50 male and female students in Year 10 and 11, which I randomly selected using the random key in the calculator (#) and inserted out of the 371 pupils altogether to be included in my investigation. The 3 statements I am going to investigate are: - Does the gender of the student have an affect on their KS2 result in English? Do students who do well in Maths, also do well in Science? How does the IQ of the students affect their results? I am interested in these specific areas because I believe that an investigation with these variables would lead me to understanding more what affects the results of the pupils. My hypothesis for my first statement is that the gender of the student does have an affect on the KS2 results in English, and that boys generally do better than girls is both Years 10 and 11. For my second statement I am making the prediction that most students who do well in Maths will do well in Science, but when students don't do well in Maths they will generally not do well in Science. My hypothesis for my third statement is that the IQ of both male and female
GCSE Statistics Coursework
Statistics GCSE coursework Kevin Sharp In my DT lesson our teacher told us to draw a 25cm line and I drew mine too big and the teacher told me to get better at maths. I did not think this would improve my ability to estimate a length of a line so decided to find out. The questions I thought up are: 1) Is there any relationship between estimating a length of a straight line linked to mathematical ability? Null hypothesis: There is a relationship between them. Alternative hypothesis: There is no relationship between them. 2) Does the estimation of a non straight line improve after practice? Null hypothesis: Practice improves the estimation of a non straight line. Alternative hypothesis: Practice doesn't improve the estimation of a non straight line. 3) Does a 14/15 year olds ability to estimate the length of a straight line fit a normal distribution? Null hypothesis: A 14/15 year olds ability to estimate a straight line fits normal distribution. Alternative hypothesis: A 14/15 year olds ability to estimate a straight line doesn't fit normal distribution. 4) Are a 14/15 year olds ability to estimate a straight line more accurate than estimating a non straight line? Null hypothesis: A 14/15 year olds ability to estimate a straight line is more accurate than estimating a non straight line. Alternative hypothesis: A 14/15 year olds ability to estimate a straight line

Mayfield High school
Mathematics coursework Introduction My second coursework for my Mathematics GCSE course is based on statistics. I have been provided with data from Mayfield High school. Mayfield is a fictional school. Mayfield School has 1183 students from year's group 7 to 11. The data that is provided on each student includes, name, age, year group, IQ, weight, height, hair colour, eye colour, distance from home to school, usual method of travel to school, number of brothers and sisters, key stage 2 results in English, Mathematics and Science. Hypothesis - The right-handed girls have an IQ number higher than the left-handed girls. I am going to investigate this hypothesis showing graphs and tables. The next table shows how many students have in each year group. Year group Students 7 282 8 270 9 261 0 200 1 70 The following table show the right and left-handed girls on school. Use right hand 448 girls Use left hand 24 girls Use both hands 6 girls Left in Blank girl Right hand I have collected 100 IQ number from the Mayfield High School based on right hand girls. The data is from different ages and year's group. I collected the following IQ numbers: 16, 105, 98, 69, 102, 101, 100, 104,103, 104,100, 99,100, 91, 122, 87, 90, 88,101, 100, 101, 103, 94, 94,105,100,102,102,100,103, 102, 90,107, 107, 106, 79, 99, 101, 106, 108,85,106, 100,93,107, 116, 100, 116,
Assessment Report
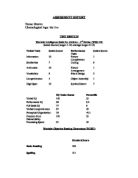
ASSESSMENT REPORT Name: Ebrahim Chronological Age: 10y 11m TEST RESULTS Wechsler Intelligence Scale For Children - 3rd Edition (WISC III) Scaled Scores (range= 1-19; average range= 8-12) Verbal Tests Scaled Scores Performance Tests Scaled Scores Information 0 Picture Completetion Similarities 7 Coding 6 Arithmatic 0 Picture Arrangement Vocabulary 9 Block Design 2 Comprehension 5 Object Assembly Digit Span 0 Symbol Search 7 IQ/ Index Scores Percentile Verbal IQ 01 53 Performance IQ 60 0.4 Full Scale IQ 77 6 Verbal Comprehension 87 9 Perceptual Organisation 50 <0.1 Freedom from Distractibility 01 53 Processing Speed 81 0 Wechsler Objective Reading Dimensions (WORD) Standard Score Basic Reading 04 Spelling 11 Wechsler Objective Reading Dimensions (WORD) Standard Score Centile Accuracy 08 70 Comprehension 84 4 Rate 08 70 Wechsler Objective Language Dimensions (WOLD) Standard Score Centile Listening Comprehension 84 4 ANALYSIS Ebrahim was administered the Wechsler Intelligence Scale for Children- Third Edition (WISC III). This test has five main scores: Full Scale score, Verbal Comprehension score, Perceptual Organisation score, Freedom from Distractibility score and Processing Speed score. Ebrahim's raw scores on each subtest is related to the performance of other children within the same four
This experiment will show that there is a significant positive correlation between males and females who perform well academically and those who gain a high point score on a self-esteem Questionnaire
Psychology Coursework An Investigation into whether self-esteem levels in boys and girls are influenced by Academic Success Paul Buchanan Candidate number 7026 Rastrick High School 6th form Centre number 37307 Introduction Self-esteem is the result of many experiences throughout life. Those with high self-esteem tend to function better and have more positive interactions than those with poor self-esteem. According to Coopersmith (1967), self-esteem is a product of individual's early relationships, particularly with parents. Growe (1980) found that maternal acceptance and positive interactions relate to subsequent self esteem in children. Those individuals with low self-esteem appear to be in need of positive self-relevant feedback and feel threatened when negative feedback is presented (Brown, Collins & Schmitt, 1988). In line with these findings, Smith and Smoll (1990) demonstrated that children with low self-esteem respond to highly supportive coaches in a positive manner, but when responses are low in support, the response from the individual is primarily negative. Self-esteem is an extremely popular construct within psychology. Individually it refers to an individual's sense of his or her value or worth, or the extent to which a person values, approves of, appreciates, prizes or likes him or herself (Blascovich & Tomaka, 1991). The most broad and frequent cited