
Investigate the relationship between the IQ and Key Stage results of a group of students.
Maths Coursework Statistics Year 10 Mayfield High School Daniel Cary Wellington College Block II My aim is to investigate the relationship between the IQ and Key Stage results of a group of students. I will show if there is any correlation between; IQ and Key Stage Results in years 7, 8 and 9 If I find an outlier in any of my graphs, I will try and explain why it is there and see if my line of best fit fits better without it. I will now conduct a pre-trial to test if there are, in fact, any of there correlations; MASOOMA ABBAS (male) IQ - 101 KS2 - Eng-3 Maths-4 Sci-4 ZAHARA ABBOTT (female) IQ - 116 KS2 - Eng-5 Maths-5 Sci-5 As you can see from the graphs on the previous page, there is some evidence of a correlation between the IQ and the KS2 results. This is highlighted by Zahara's IQ being noticeably higher than Masooma's. So too are her Key Stage 2 results. I can conclude therefore that there is reason for me to continue with my tests. The findings of the pre-test suggest a possible correlation between the IQ and Key Stage 2 results of these particular students and therefore makes my project worthwhile. Throughout this coursework, I will be using stratified sampling. In order to do this, I will divide the population into groups which have something in common. Simple random samples will then be taken from each group. The number taken from each

Mathematics Statistics Coursework
GCSE Mathematics Statistics Coursework A. Introduction My Task is about intelligence. The questions that I am going to investigate are: . -The mean of boys and girls in SATS scores. -The area/frequency of boy's and girls SATS score. 2. -The correlation and relationships between the IQ of Year 7 Boys and Girls, Year 11 Boys and Girls; and also the SATS scores of Year 7 and 11 Boys and Girls. -What happens to the frequencies as the IQ and SATS scores goes higher? B. Hypotheses The hypotheses I will be testing are whether -Boys do better in SATS than girls - The higher the IQ, the higher the average SATS score. I think that these hypotheses are true as boys, historically, have a better mean than girls, and if you are more intelligent than someone, (calculating from your IQ), you will do better in your SATS. C. Plan of Action - Data Collection I will need to collect the data from Mayfield High School. The data I will need to collect are "Year 7's boys; Year 7 girls; Year 11 boys; Year 11 girls" data. This data will be useful as I can use and explain a wide range of data from both genders and I can conclude the intelligence of elder and younger pupils. I will only collect a little data from each data group e.g. 20 pupil's data from the "Year 11 girls" data group. I will need to take a sample from the population, as it'll be quick as well, instead of using the whole

The aim of my investigation is to use and apply my understanding of statistics and statistical techniques to investigate the two following hypothesis - There is a correlation between Key Stage 3 (KS3) and GCSE results.
INTRODUCTION The aim of my investigation is to use and apply my understanding of statistics and statistical techniques to investigate the two following hypotheses: SCHOOL A -Highgram School Hypothesis 1: There is a correlation between KS3 & GCSE results. RAW DATA (table 1) GENDER KS3 LEVEL GCSE GRADE GENDER KS3 LEVEL GCSE GRADE BOY 3 U BOY 7 A BOY 3 U GIRL 3 E GIRL 3 G GIRL 3 D BOY 4 U BOY 4 F BOY 5 E GIRL 5 E GIRL 5 C BOY 5 D GIRL 5 E GIRL 5 D GIRL 5 E BOY 5 D GIRL 6 D BOY 5 E BOY 6 D GIRL 5 D BOY 6 D GIRL 5 C GIRL 6 C BOY 5 D BOY 6 D BOY 5 D GIRL 6 C GIRL 5 C GIRL 6 E BOY 6 B BOY 6 D GIRL 6 C GIRL 6 C BOY 6 D BOY 6 D GIRL 6 D GIRL 7 B GIRL 6 A BOY 7 A GIRL 6 C GIRL 3 F GIRL 6 D BOY 3 G GIRL 6 C GIRL 4 F GIRL 7 A BOY 4 U GIRL 4 U GIRL 5 E BOY 5 E GIRL 5 E GIRL 6 B GIRL 6 B GIRL 6 C BOY 6 B BOY 6 E GIRL 6 C GIRL 6 C GIRL 6 B GIRL 6 B With my acquired raw data (table 1) I will construct a frequency table (table 2) to condense the information and make it easier to read, understand and utilise. FREQUENCY TABLE (table 2) KS3 Level 3 Level 4 Level 5 Level 6 Level 7 TOTAL Boys 3 3 7 9 2 24 Girls 4 2 0 8 2 36 TOTAL 7 5 7 27 4 60 GCSE U G F E D C B A TOTAL
Data Handling.
Maths Coursework: Data Handling In this investigation I am comparing body mass index (BMI) against average number of hours of TV watched a week to see what correlation (if any) there is. This is because it seems relevant to BMI (since the less exercise people do the heavier they are, thus the higher BMI). The aim will be to show the correlation, if one exists, clearly and prove it, taking into account and bad results or bias in the data. To do this, I will first look at the population (1200 people). I must have at least 5% for the results to be reliable and without bias, so I will take 240 people (5%) as the sample. I will take stratified samples, and work out each person's body mass index; this is done by dividing their weight in kilograms over their height squared in metres. The groups I will be dividing them into for stratified sampling will be gender and year group, which I will then take 48 simple random samples from each group. A more detailed investigation could be done by adding other factors, such as distance from school or method or transport to school (allowing more or less time to watch TV). My hypothesis is that males will watch TV more, and the higher the years will watch more TV. The two categories I have chosen (gender and year group) will be sufficient to show a correlation however, since it will show any trends between gender and/or year group towards their

Critically consider the role of genetic factors in the development of measured intelligence.
Critically consider the role of genetic factors in the development of measured intelligence. Genetic factors are a major influence on the development of measured intelligence. However, extensive research suggests that genetic factors alone cannot account for a person's intelligence. Research evidence suggests that a person's intelligence isn't 'fixed' from birth, but environmental and social factors can cause an increase in intelligence. The importance of genetic factors in intelligence is exemplified in family resemblance studies. This involves examining the correlation of intelligence test scores among people who vary in genetic similarity. If genetic factors influence IQ then the closer the genetic relationship between two people, then the greater the correspondence rate (concordance) between their IQ's should be. In Bouchard and Mcgue's worldwide review of 111 studies, they found the closer the genetic relationship between individuals the higher the correspondence of IQ scores. For example the correlation for cousins (who share 12.5 % of their genes) is weaker than that for parents and offspring who share 50 % of their genes. The strongest Correlation is for Monozygotic twins (identical twins) who share the same genes.Therefore,these findings suggest that genetic factors play a key role in measured intelligence. However, the main criticism of these findings is that as

Mathematics coursework
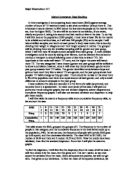
Mathematics coursework Introduction Al the way through my coursework I will be exploring the positive and negative correlation between IQ scores and exam results in The Swaminarayan Independent day school. I also used data provided by Edexcel on the KS2 results and the IQ results in the Mayfield School. I will be carrying out investigation to see whether the IQ results have any significance towards how a student performs in his exams. Mayfield Data IQ 89 03 98 08 94 91 16 04 03 90 97 16 94 13 06 95 05 01 Total KS2 results 9 3 9 5 0 1 5 3 3 2 0 5 0 2 3 2 3 2 As you can see above, there are the first 30 IQ results by the Mayfield data. I will now try and prove that there is some kind for correlation between these two sets of data above. I will create a scatter graph in the Edexcel programme. As you see above, there is a positive correlation between the IQ scores and the total KS2 results. Now I will see whether there is correlation between the IQ scores and the English scores. IQ English 89 3 03 4 98 3 08 5 94 3 91 4 16 5 04 4 03 5 90 4 97 2 16 5 94 4 13 4 06 5 95 4 05 4 01 4 As seen above there is correlation between the IQ scores and the English results as there is positive correlation proving that if you have a higher IQ you are more likely to achieve good results in English. My Hypothesis

Statistics Coursework.
Who achieves better marks in their SATS Exams Girls or Boys? Page no. 3 Introduction Introduction My name is Ikhlas Raja and I am studying GCSE Statistics. I live in Luton which is a town North of London. I go to Challney High School for Boys. Our school is an all Boys school but there is a Girls school right next to us. It is a well rated school for its grades it achieves, it is one of the best Boys School in the whole of the U.K. We study Statistics during the whole of Year 10. Coursework accounts for 25% of the final Exam marks. Our teacher gave us two weeks to decide a subject we wanted to base our coursework on. I decided to look at both Key Stage 2 SATs results Key stage 3 SATs results for Both Girls and boys. We started our Statistics Coursework around 4 weeks ago. I decided to do coursework on Key Stage 2 and Key Stage 3 SATs results because I thought that it would be quiet interesting finding out who achieves the better results. I keep on hearing from my sisters that girls are better than boys in education. I wanted to see if they are right if not I will be able to prove them wrong. I was about choose a different subject for my coursework, I was about to do about how much people spend on computer games. I decided against it because I thought that it would be hard to obtain the data. It would be hard because I would have to ask a specific group of