
Math Investigative Task - calculating the value of metal used in coins.
0B Maths Investigative Task By: Aadharsh. D ________________ Part 1 ________________ 2. The article was written on 11 April 2006. 3. a) The article mentions that there are 160 pennies in one pound. This means that 160 pennies weigh 0.45359237 kilograms. To find out the weight of one penny in kilograms, divide the weight by the number of pennies. Therefore, it will be 0.45359237 kilograms ÷ 160 pennies = 0.0028349523125 kilograms or 2.8349523125 grams. For ease of calculation, I will be taking it as 2.835 grams. b) The article mentions that a coin is made up of 97.50% zinc. This means that 97.50% of the total mass of the coin is the mass of the zinc present in the coin. To find out the mass of the zinc, we have to calculate 97.50% of the total mass of one coin. We can calculate this with this calculation: 2.8349523125 x 0.975= 2.7640785046875 grams. For ease of calculation, I will be taking it as 2.764 grams or 0.006 pounds. c) The article states that a coin is made up of 2.5% copper. This means that 2.5% of the total mass of the coin is the mass of the copper present in the coin. To find out the mass of the copper, we have to calculate 2.5% of the total mass of one coin. We can calculate it with this calculation: 2.8349523125 x 0.025 = 0.0708738078125 grams. For ease of calculation, I will be taking it as 0.071 grams or 0.0015 pounds 4. Ed Yardeni claims that we

Statistical Experiment Plan to investigate the ability to estimate 30 and 60 seconds.
I am interested in investigating the ability of teenager at estimating periods of time, and also seeing how the data of people estimating periods of time is spread out. I am doing this because I want to see if there is relationship between the estimate of periods of time. So if someone is good at estimating one period of time they are also good at estimating another similar period of time. Also I want to see how the data of people estimating time periods is spread out. My hypotheses are: Year 11 are better at estimating 60 seconds than year 7 s The better you are at estimating 30 seconds the better you are at estimating 60 seconds Year 11 data follows the normal distribution. I want to investigate hypothesis one because I want to see if age has an effect on the ability to estimate. I believe this as elder students have had a longer education and due to this they generally have a better grasp at estimating time than year 7's who would, I believe would underestimate because they are younger and do not have a good grasp of estimating a second and have little or no relationships between their pieces of data as they fundamentally don’t understand how to estimate periods of time. Year 11 are better at estimating 30 and 60 seconds than year 7 s For hypothesis 1 I will collect all my data from Winston Churchill School as I can easily and quickly obtain data from the school. I
Data handling. There are many different ways of collecting data. A common method of collecting data is to use a questionnaire.
Maths H/W Data Collection There are many different ways of collecting data. A common method of collecting data is to use a questionnaire. Questionnaires take many forms, and are carried out using a variety of methods. There are four main methods of collecting data which are: face to face By phone By post Over the internet There are advantages and disadvantages of using each of these methods. The advantages and disadvantages of face to face are: Advantages You can ask better and more specific answers to get more complex and better results. The person taking the answers can explain the questions in more detail when necessary. The person interviewing is likely to be more consistent at recording the responses. Disadvantages This method of interviewing takes a long time and might be expensive than other data collection methods. The interviewed person is more likely to refuse answering the question or they might lie if they give an answer. Questionnaires can also include: yes or no answers ticking boxes numbered responses word responses questions which require a sentence to be written Whichever style of question is used, it is important that they are easy to understand, cover every possible answer, are unbiased and unambiguous. It is also important that you ensure that they are appropriate to your survey. It is important that a question

This is my GCSE data-handling project, throughout which I will be discussing the topic of how sleep deprivation affects the reaction and ability to estimate a minute.
Statistics coursework Introduction: This is my GCSE data-handling project, throughout which I will be discussing the topic of how sleep deprivation affects the reaction and ability to estimate a minute. Plan: Hypothesis My hypothesis is: * People who get more sleep will have faster reaction times than people who get less sleep * People who get more sleep will be better at estimating a minute than people with less sleep. * Females will do better than males. Hopefully the competitive attitude of many people to tests involving males versus females will make sure that the subjects are trying to get the best scores they possibly can, and this should reduce the number of anomalous results I receive. To test my hypothesis, I will need to collect data from a random sample of people. The data I need to collect is: * Age * Gender * Reaction Time * Ability to calculate a minute * How many hours of sleep they get a typical night Data Collection I will collect the Age, and Gender and amount of sleep they get per night simply by asking the subject, but collecting results for the 'ruler drop' test will be slightly more complicated. Below I will describe the method I will use for all subjects. To perform this experiment I will use a reaction timer. The tester will hold the ruler, and whilst standing ask the subject to put their thumb and first finger over the bottom of the
The relationship between level of parental education and SAT scores
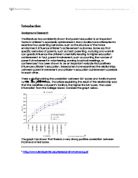
Introduction Background Research The literature has consistently shown that parent education is an important factor in children's academic achievement. Many studies have attempted to examine how parenting behaviors, such as the structure of the home environment, influence children's achievement outcomes. Some say that specific behaviors of parents, such as harsh parenting, nurturing and warmth can greatly influence the children's mentality leading to higher education achievement. In fact, parent involvement, such as counting the number of parent's involvement in volunteering, coming to school meetings, or conferences.1 has been shown to be an important variable that positively influences children's education. Researchers have examined the relationships between parent involvement and children's education achievement correlate to each other. There a study involving the correlation between SAT scores and family income by the New York Times. The article explaining the result of the relationship says that the wealthier a student's family is, the higher the SAT score. They used information from the College Board. Consider the graph below. Source: College Board 2 The graph has shown that there is a very strong positive correlation between income and test score. http://www.lewiscenter.org/research/inwhatways.pdf 2

Maths Mice Coursework
Mice Coursework Introduction In this coursework I am going to compare two sets of data about the weight of male and female mice. I am then going to make a hypothesis about the weights of these mice and then find out whether or not I am correct. Hypothesis My hypothesis is that male mice will be heavier than the female mice. I think this because usually males need to eat more and tend to be bigger. Grouping the Mice. In this coursework I will also have quite a few graphs. By making these graphs I can compare the data and then see if the results support my hypothesis or not. I will start of by put the mice into groups. By doing this it will save me a lot of time and make my data my easier to compare. Also grouping the data enables me to draw the graphs which help me to compare the data. After I group the data I will also find the mean average for both sets of mice. Female Groups Frequency (f) Midpoint (X) f x X 0 ? w < 5 5 ? w < 10 0 ? w < 15 5 ? w < 20 20 ? w < 25 25 ? w < 30 0 9 29 7 25 27 2.5 7.5 2.5 7.5 22.5 27.5 0 42.5 362.5 22.5 562.5 742.5 Total: 107 Total: 1932.5 So the mean average of female mice is 1932.5÷107= 18.10 (2 d.p. places) Male Groups Frequency (f) Midpoint (X)

Maths driving test
Introduction The hypothesis I am testing is: * "The number of mistakes a candidate makes during their driving test is affected by the number of one hour lessons that they have had." In this report I should find out what affects the number of mistakes a candidate makes during his/her driving test. Expectations * I expect that the number of mistakes made will be affected by the number of lessons taken. I think this as the more lessons you have make the driver learn more efficiently. Also this could give the driver more confidence in driving. Exceptions There are some factors which could affect this hypothesis. * The driving instructor- this could affect the number of mistakes as the instructor may not be very good. Also some instructors have better teaching methods than others and this may make a candidate learn quicker. * Gender of the candidate- it could depend if the candidate is male or female. . It has been stated that boys and girls perform differently, and that boys often do better in practical tests that girls do. This may mean that males won't need as many one hour lessons that girls need. * Any extra practise form siblings or parents- some candidates may have used their extra time to take part in any extra driving practise. The data provided doesn't state whether or not anyone has had any extra practise and this could affect the number of mistakes

Rollercoasters. I will use the rollercoaster database to answer the following question: Is it true that the fastest rides are the most exciting?
Mathematical Enquiry I am going to be completing a statistical investigation from some collected data. This will be obtained from a World Rollercoaster Database. The information that can be seen from the database about an individual rollercoaster is: which country designed it, when it opened, its height, its length, its max speed, the ride time, and the thrill factor out of 10. I am going to investigate whether the fastest rides are the most exciting. I would like to answer this question during the course of the investigation. Hypothesis I will use the rollercoaster database to answer the following question: "Is it true that the fastest rides are the most exciting?" The aim of the investigation is to answer this question. Here is a list of possible hypotheses: a) Faster rides are the most exciting. b) There is a relationship between the max speed of rollercoaster's and their thrill factor, although the correlation is not consistent. c) Faster rides are not necessarily the most exciting. I think that faster rides tend to be more thrilling and daring, so therefore more exciting. For this reason, I believe that hypothesis a) is correct. Prior to collecting the results, I will create a questionnaire to give to people on their thoughts of this prediction. I will need to collect data for max speed (km/h) and the thrill factor out of 10 for a selected rollercoaster. This
maths estimation coursework
Section B In this section of my assignment, I will carry out my own investigation on estimation similar to the previous investigations I have analysed. Although in this investigation I will improve upon the previous investigations, taking what they left out from their investigations and including it in my own. I am doing this investigation as the previous investigations had some missing information, and some did not have representative samples, my investigation will be representative of the estimating population and will have more reliable data to ensure that more conclusions can be drawn from the estimations given. The secondary data from the previous investigations seemed to suggest that there may be a link between estimation and gender, particularly David, Mary and John's results, I will see if this is the case in my own investigation, while also taking age into consideration at the same time. Also, Michael's data showed a correlation between estimation of angle and estimation of length. I will explore this also in my investigation. The estimating population shall be comprised of Year 8's and Year 12's from our school. I chose this population as there is a well-established age gap between the two years and I believe these will be reliable results a all of these year 12s are also doing estimation coursework and therefore will take the estimation. Also the age gap will
Data Handling
In this piece of coursework I am going to test to see if my Hypothesis is correct. The aim of this investigation is to investigate the following hypothesis: "The lower your BMI is the fitter you are so your mean resting pulse rate should be lower." Introduction The data has been collected from three-year groups. Year 7, 9 and 11. The maths department has decided on these year groups, as there is two years in between each group. In years 7 and 9 the data was collected from sets A,B,C and D. Whereas year 11 the data was collected from all sets from A to F. The decision to only use A-D for years 7 and 9 was that it is more practical and some pupils from the lower sets are immature and may not take it seriously and this would obstruct the investigation. While in year 11 pupils are more grown up and act in a civilized manner. The data had no results from girls as it is an all boys' school in which the data was collected from. Each pupil was given a survey sheet. There was a few details that need to be filled in they were: . Do you have a medical condition? Yes / No 2. How old are you? Years and Months 3. Are you a member of a sports team? Yes / No 4. How many hours of sport do you do a week? Number of hours Each class took their pulse rate 5 times and found the average of the 5 results. The mean was then recorded. Each Year group that was doing the investigation went