
Data Handling
MATHS COURSEWORK YEAR 11 1GRS CAR'S COURSEWORK Maths Coursework 2004 I will be investigating about what influence second hand car prices. This coursework is worth 21 marks and therefore I'm going to work hard in order to achieve the highest grade possible. In this coursework I will be showing how factors such as mileage, age, engine size etc. affect the prices of second hand cars. I will be presenting graphs for all the factors that affect the prices and showing a comparison between the prices and each of the factors that I have stated. PLAN The aim of this investigation is to find out what influences the price of second hand cars. Second hand cars cost less than brand new cars due to factors such as mileage, Age, etc. First, I will be deciding the key factors, which could influence second hand car prices and also the factors that have a low or zero affect on the prices of second hand cars. I will be deleting these factors from the database. Here are the key factors. Age 2 Engine size 3 Mileage 4 Insurance 5 Number of Doors 6 MPG 7 Number of Owners Here are the low affect factors. Style 2 Central locking 3 Seats 4 Air conditioning 5 Airbags I have decided to use the first 48 cars on my database to gain an evaluation of what affects second hand car prices. I could not use all my database because the results will be vary also it will be very

Correlation and regression
Ibrar Khan AS Use of mathematics coursework Correlation and regression Background information In statistics, correlation often indicates the strength and direction of a linear relationship between two random variables. If there is no correlation between the two sets of data, the points will be widely scattered and will require a circular shape to enclose them. If the two sets of data have weak positive correlation, the points can be modelled in a broad eclipse sloping upwards from bottom left to top right. Furthermore if the two sets of data have a strong positive correlation, the points lie within a narrow eclipse sloping upwards. If the two sets of data have weak negative correlation, where one quantity generally increases as the other one decreases, the points can be modelled in a broad eclipse sloping downards from top left to bottom right. If the two sets of data have a strong positive correlation, the points lie within a narrow eclipse sloping downwards. Finally 'perfect' positive correlation (a correlation co-efficient of +1) implies that as one variable moves, either up or down, the other variable will move in lockstep, in the same direction. Alternatively, 'perfect' negative correlation means that if one variable moves in either direction the variable that is perfectly negatively correlated will move by an equal amount in the opposite direction, also when all

For our GCSE statistics coursework, we were given the question Where are houses most expensive? To answer this question I have posed the hypothesis House Prices for 3 bedroom detached houses in the North of England are cheaper than those in the s
Statistics coursework Hypothesis: 'House Prices for 3 bedroom detached houses in the North of England are cheaper than those in the south of England. Therefore the south is a more expensive region'. Hypothesis and strategy For our GCSE statistics coursework, we were given the question 'Where are houses most expensive?' To answer this question I have posed the hypothesis 'House Prices for 3 bedroom detached houses in the North of England are cheaper than those in the south of England. Therefore the south is a more expensive region'. I chose this hypothesis as the south stereotypically have been known for having more expensive houses and therefore its occupants enjoy a higher standard of living than those in the north. I need to gather evidence to support my hypothesis or not to support my hypothesis. Also I have chosen a 3 bedroom detached house as this seems to be the average household that the bulk of the English population live in. I will gather evidence to help my investigation by doing the following: * Firstly I will collect my data, 30 pieces from the north and 30 from the south, from different counties in the north and south. * From the data I have collected I will produce a histogram to determine the shape of the distribution which is important as this will then show me the best measure of average that needs to be used. If the histogram shows a normal
Fixed Point Iteration
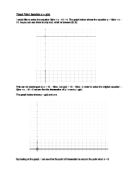
Fixed Point Iteration x = g(x) I would like to solve the equation 1/2lnx + x - 10 = 0. The graph below shows the equation y = 1/2lnx + x - 10. As you can see there is only root, which is between [8, 9]. This can be rearranged to x = 10 - 1/2lnx. Let g(x) = 10 - 1/2lnx. In order to solve the original equation - 1/2lnx + x - 10 = 0 we can find the intersection of y = x and y = g(x) The graph below shows y = g(x) and y=x. By looking at the graph, I can see that the point of intersection is around the point when x = 8. Let x1 = 8. I will use the following equation: Xr+1 = g (xr) The table below shows the iterations. x = g(x) X1 8 8.960279 X2 8.960279 8.903599 X3 8.903599 8.906772 X4 8.906772 8.906594 X5 8.906594 8.906604 X6 8.906604 8.906603 X7 8.906603 8.906604 X8 8.906604 8.906604 X9 8.906604 8.906604 X10 8.906604 8.906604 The rearrangement of 1/2lnx + x - 10 = 0 to x = 10 - 1/2lnx converged to the root 8.906604 because the gradient was not too steep in that region. In order for the rearrangement to be successful we must have - 1 < g ' (x) < 1. The gradient function of x = g(x) is g ' (x) = -0.5 In this case g ' (x) = -0.5 8.906604 = - 0.0561 which is between [-1, 1] The method found that x = 8.906604 to 7 significant figures. In error bounds x = 8.9066035 ± 0.0000005 The method can also be shown
Statistics coursework
GCSE maths coursework - Statistics Introduction and planning The data I have been given is from a driving school's records based on how well 240 of their drivers did in their driving exams. I am going to use this data for statistical analysis, which will prove or disprove my hypotheses. Hypothesis: a hypothesis is a statement; this statement could be proved true or false from data relevant to the statement. I will be using graphs and statistical data to make my data analysis easy to compare and to verify my hypothesis. My hypotheses are: . Male drivers perform better than female drivers in their driving tests. I.e. they make fewer mistakes. Better means to be superior in some personal quality or attainment, so in the case of my main hypothesis I would like to prove that men are better drivers than females. I chose my core hypothesis because I thought it was very interesting and a very controversial statement that interests me. There has also been scientific research carried out to prove or disprove this statement worldwide. 2. The more driving lessons a pupil has the less minor mistakes they will make in their driving test; I think this is true because the driver will gain more experience through more driving lessons and there will be negative correlation shown in this hypothesis between these two factors. Correlation is the relationship between two variables.
Maths Coursework
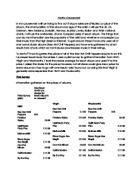
Maths Coursework In my coursework I will be trying to find out if album sales are affected by price of the album, the chart position of the album and age of the artist. I will use the US, UK, German, New Zealand, Swedish, Norway, Austrian, Swiss, Italian and Finish national charts. I will use the worldwide, US and European sales of each album. The things that can slur my information are the popularity of the artist and whether or not people buy their music from the high street or internet. To get around these I have only used all of one bands studio albums (Red Hot Chili Peppers) and have only gathered my chart results from charts which do not include downloaded music in their ratings. To start off I had to gather the prices of all of the Red Hot Chili Peppers albums to do this I surveyed local music franchises. I used a pilot survey to gather information from HMV, Virgin and Woolworths. I took the modal average for each album and used it for the price. I asked the stores for the price; however, not all stores could give me a price for every album so I had to go with one result. I also found out by doing this that Virgin is generally more expensive than HMV and Woolworths. Pilot Survey Information gathered on the prices of albums. Price Survey (pilot) How Much do/did you charge for these Album's on release? HMV Virgin Woolworths Red Hot Chili Peppers N/A Red Hot
IGCSE Modeling Project bouncing ball
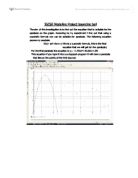
IGCSE Modeling Project bouncing ball The aim of this investigation is to find out the equation that is suitable for the parabola on the graph. According to my experiment I find out that using a quadratic formula can use be suitable for parabola. The following equation proves my analysis: f(x)= ax²+bx+c ( this is a quadratic formula, this is the final equation that we will get for the parabola) For the first parabola the equation is y= -1.725x²+10.02x+1.99 This equation if you type it into a autograph program it will draw a parabola that lies on the points of the first bounce: to find the values for the equation I use this formula: = P (x-m) (x-n) = P (x²-nx-mx+mn) = P (x²+x(-n-m)+mn) This formula will turn to a quadratic formula after solving it, and then it would be the equation for the parabola. For example for the second parabola if you plot in the lowest and highest X coordinate in the bounce it should come out like this: = P (x-6) (x-12) Then if you solve the equation it should turn out like: y= P (x²-18x+72) Value P basically is the value that influence the curve so it's a very important value in this equation. In order to find out P we have to take point from the table for example 9 then to find P we have to : f(9) =P (9²-18(9)+72=13.21 = P = 13.21/-9 = P = -1.46778(5d.p) Therefore the equation should be y= -1.4677.....8 (x²-18x+72) And

To test my hypothesis, I will use primary data. I will collect information from same houses in Mepton Bridge. I will compare Mepton Bridge to the whole country using secondary data.
Handling Data Cycle Introduction: This project is about the sizes of families in the area where I live. I am going to investigate how my town, Mepton Bridge, compares with the whole country. People who do town planning need to know about the type of households in an area and use tis kind of information. For example when planning new schools, parks and play areas. Hypothesis 'The average number of children living in each house in Mepton Bridge, is higher than the country average' I think this because Mepton Bridge is a growing town with a lot of new houses and young families. Plan of Action To test my hypothesis, I will use primary data. I will collect information from same houses in Mepton Bridge. I will compare Mepton Bridge to the whole country using secondary data. I will count people who are less than seventeen years old as children. Because the town is too big to fid out the number of children in every house, I have decided to choose five streets at random from the 876 streets on the list on the A-Z map of Mapton Bridge. This might not work very well because the street may not have any Houses. For example one street might be in an industrial estate. I need to have streets in different parts of the town to covert he difference across the town. If I do not get enough houses, or all the streets are in part of Mepton Bridge, I might need to extend my sample by
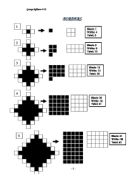
Borders - find out the differences in the patterns of the colored squares.
BORDERS A Table of Results Num. num black num white total . 0 1 1 2. 1 4 5 3. 5 8 13 4. 13 12 25 5. 25 16 41 6. 41 20 61 7. 61 24 85 8. 85 28 113 9. 113 32 145 N Total Structure 1 (1+1)2+1² 2 5 (2+1)2+2² 3 13 (3+1)2+3² 4 25 (4+1)2+4² 5 41 (5+1)2+5² 6 61 (6+1)2+6² 7 85 (7+1)2+7² 8 113 (8+1)2+8² 9 145 (9+1)2+9² Order of the squares + 3 + 1 = 5 + 3 + 5 + 3 + 1 = 13 In each of these cases, 2 have been added. + 3 +5 7 + 5 + 3 + 1 = 25 As seen in the other pattern, there are additions with 2 being added on. For the next pattern, I think that the total number of squares will be 41, using the following pattern: + 3 + 5 + 7 + 9 + 7 + 5 + 3 + 1 = 41 Now I am going to test my prediction. Number of squares = 25 + 16 = 41 Pattern Dark squares White squares 4 + 4 = 5 2 5 8 5 + 8 = 13 3 3 2 3 + 12 = 25 4 25 6 25 + 16 = 41 This result is made because we are just adding onto it. Differences Total 5 13 25 41 61 85 113 145 181 221 st difference 8 12 16 20 24 28 32 36 40 2nd difference 4 4 4 4 4 4 4 4 From the quadratic sequence, we see that the main difference is 4. The first

Maths grid extension
This is a 10 x 10 size grid with a 3-stair shape in blue. This is called the stair total. The stair total for this stair shape is 25 + 26 + 27 + 35 + 36 + 45 = 194. To investigate the relationship between the stair total and the position of the stair shape, I will use the far-left bottom square as my stair number: This is always the smallest number in the stair shape. It is 25 for this stair shape. I will then translate this 3-stair shape to different positions around this 10 x 10 grid: 46 36 37 26 27 28 The stair-total for this stair shape is 26 + 27 + 28 + 36 + 37 + 46 = 200 87 77 78 67 68 69 The stair-total for this stair shape is 67 + 68 + 69 + 77 + 78 + 87 = 446 88 78 79 68 69 70 The stair-total for this stair shape is 68 + 69 + 70 + 78 + 79 + 88 = 452 23 3 4 3 4 5 The stair-total for this stair shape is 3 + 4 + 5 + 13 + 14 + 23 = 62 24 4 5 4 5 6 The stair-total for this stair shape is 4 + 5 + 6 + 14 + 15 + 23 = 68 Stair number Stair Total 25 94 26 200 67 446 68 452 3 62 4 68 I will then summarize these results in a table: In order to find a formula that I can use to find the stair total when I am given the stair number, I am going to put the stair number as the position and the stair total as the term for the sequence: Position 25 26 67 68 3 4 Term 94 200 446 452 62 68 + 6 + 6 + 6 I have noticed that