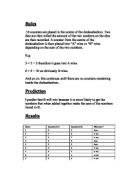
Information on table of results
On the table below along the top is the number of throws it took for someone
to win.
And, along the side is the game number (game number 1,2,3,4,5 etc.)
Where it has the letter X it means that whichever letter was throwing at the
time – didn’t win on that particular throw. Therefore when it says another letter,
either A, B or C, it means that particular letter won on that specific throw.
Table of Results
After all this I decided it would be a good idea (as did my teacher) to
collaborate my results with someone else. I decided this would be a good idea
because then I can back up any possible assumptions/rules that may be starting
to appear.
Having collaborated my results with a friend, Laurence, I came to a more
definite but not yet firm conclusion. His individual results were: A won four times
(4/30), B won twelve times (12/30) and C won fourteen times (14/30).
Now, collaborating the results together I came to this: A won six times (6/60),
B won twenty-five times (25/60) and finally C won twenty-nine times (29/60).
Conclusion
Now that I’ve carried out the experiment and I’m happy that I did it in a clear
and organised way I can come to a few conclusions. I believe at the present
moment C has the highest probability in winning – (29/60) overall confirms this.
Also another conclusion is that C was the most likely winner, I believe this
was because on each throw it took, it had a 50% chance of winning whereas this
wasn’t the case with A and B. A had only a 16.6% chance of winning and B
had a reasonable 33.3% chance of winning each time it took a throw. I have a
good idea that this was the telling factor in the results that I took down. I think
that due to the percentage chance of winning C won the most and A the least.
I am finding that trends are beginning to appear in the results. For a start from
my results A never won on its first go. If B won it normally won on its first go as
the next person to throw was C and it won frequently on the third throw – in fact
it won thirteen out of fifteen times it won, on its first throw (the third throw).
This amounted to almost half the number of games played that C won on its first
throw. Again I think this was to do with the percentage chance of C winning.
Lastly I’ve found that all the games were particularly short in length. As a whole
the average length of game was 109/30 = 3.63 throws. However I think the most
likely length of game is three throws in which C wins.
Now I’ve collected some results I can look to find a rule/pattern/formula for
n. This is important to try and work out as it might help me discerning a rule for
this particular investigation. The formula for finding the probability is Probability
= number of successful outcomes / total number of outcomes. Using this A was
6/60 = 0.1, B was 25/60 = 0.42 and C was 29/60 = 0.48. These answers tell us
that C was the most likely winner as I predicted, B a close second and A the
least likely. So, the formula for finding the probability is s/n. s stands for the no.
of successful outcomes and n stands for the total possible outcomes.
Now I am going to write some new conclusions that I have come to after
doing some extensive theory work. Hopefully I will be able to give the right
answers at the end of this. Below are all the probabilities that I’ve worked out.
P (A wins on 1st throw) = 1/6 (3/18)
(B ) = 5/18
(C ) = 5/18
Nobody wins on 1st throw = 5/18
P (A wins on 2nd throw) = 15/324
(B ) = 25/324
(C ) = 25/324
Nobody wins on 2nd throw = 25/324
P (A wins on 3rd throw) = 75/5832
(B ) = 125/5832
(C ) = 125/5832
Nobody wins on 3rd throw = 125/5832
P (Of A winning after 1st and 2nd throw) = 69/324
( B ) = 115/324
( C ) = 115/324
( nobody ) = 25/324
P (Of A winning after 1st, 2nd and 3rd throw) = 1317/5832
( B ) = 2195/5832
( C ) = 2195/5832
( nobody ) = 125/5832
P (A wins on 4th throw) = 124/104976
(B ) = 625/104976
(C ) = 625/104976
(nobody ) = 103602/104976
I deducted from these results that there was a clear ratio between the results
of A compared to B and C. A’s results were in the ratio of 3:5 to B’s and C’s
results. This was a clear and very important result. For example the results for
the probabilities of each of A, B and C after the 1st and 2nd throws were A =
69/324, B and C (the same) 115/324. If you divide 115 by 5 you get 23, this
multiplied by three is 69 – this clearly shows the ratio of 3:5.
From these findings I was then able to work out the answer for the most likely
winner. As the probability for each of A, B and C respectively had been worked
out to show that A was less likely than B and C – and the fact that B and C had
the same probability which was the equal highest of all of them; B and C had to
be the most equally likely winner.
Finally I worked out that the most likely length of game in terms of number of
rolls of the dice was three rolls. First of all I thought that as B and C were the
most likely winners that possibly 2,3,5 and 6 (which corresponded to B and C’s
first two throws) would be the most likely number of rolls before there was a
winner. However I looked at my own results and Laurence’s and found that C
won the most times out of all the games played (in my results 15/30) and an
amazing thirteen times out of that fifteen it won on its first throw (which was the
game’s third throw). This was the main reason I decided that three rolls was the
most likely.
So, to sum up my answers are as follows:
1. P (Of A winning) = 3/13
( B ) = 5/13
( C ) = 5/13
2. B and C were the most likely winners equally.
3. Three rolls
Evaluation
Overall my experiment has been a successful one and I’ve come to a few
conclusions that seem to be getting towards firm conclusions, which I can rely
on. I believe my experiment to be fairly reliable because I took the results down
carefully and accurately. Also I collaborated my results with someone else to
give me a more reliable look at my results and confirm any possible patterns.
This made it increasingly reliable.
However saying this I would have liked to done a bit more playing of the
game as the more I played the game the more reliable the results would have
been. Although one could argue playing the game over and over again may not
help or influence any conclusions that one’s already drawn up. Also maybe I
could have drawn a bigger probability tree to possibly help improve the reliability
of my investigation and give me a clearer idea of a firmer conclusion.