Josh Anderson 11S Page 1
Gary’s Car Sales
Mathematics Coursework
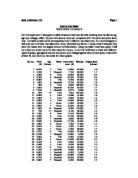
For this experiment I was given a table of second hand cars for sale showing how the factors eg. age and mileage, effect the cost of a second hand car, compared with the same cars price when new. The table consists of 36 cars separated into 5 different manufacturers. For my investigation I will only use 3 of these manufacturers, Ford, Vauxhall, and Rover. I chose these 3 because they were the makes with the largest amount of information. Using the table I have been given I will try to find out which car is the best value for money. To do this I will have to draw two different types of graph, age against second hand price, and mileage against second hand price, draw a line of best fit, and work out formulas for these graphs.

Page 2
Using the table I have drawn 4 graphs for age against second hand price. I have done 1 graph for each of my chosen manufacturers, Ford, Vauxhall, and Rover, and 1 with all three makes on it. I have used scatter graphs with lines of best fit, and have used the lines of best fit to work out the gradient using the formula x / y.
My first graph is for Ford. The line of best fit is a strong, negative correlation.
The price of a new Ford would be £7,900 and would ...
This is a preview of the whole essay
Page 2
Using the table I have drawn 4 graphs for age against second hand price. I have done 1 graph for each of my chosen manufacturers, Ford, Vauxhall, and Rover, and 1 with all three makes on it. I have used scatter graphs with lines of best fit, and have used the lines of best fit to work out the gradient using the formula x / y.
My first graph is for Ford. The line of best fit is a strong, negative correlation.
The price of a new Ford would be £7,900 and would be worth nothing when it is 10.9 years old
Using the line of best fit I have worked out the gradient:
1450 / 2 = 725
Therefore £725 is lost each year on a Ford car.
My second graph is for Vauxhall. The line of best fit is a strong, negative correlation. There is one odd point because that car is worth a lot more than most of the other Vauxhall’s when it is new.
The price of a new Vauxhall would be £8,200 and would be worth nothing when it is 11 years old.
Using the line of best fit I have worked out the gradient:
1500 / 2 = 750
Therefore £750 is lost each year on a Vauxhall car.
My third graph is for Rover. The line of best fit is not a very strong, negative correlation. There is one odd point because that car is worth a lot more than most of the other Rover’s when it is new.
The price of a new Rover would be £5,800 and would be worth nothing when it is 12.6 years old Using the line of best fit I have worked out the gradient:
900 / 2 = 450
Therefore £450 is lost each year on a Rover car.
This means that Rover loses the least amount of money each year.
Y = Answer C = Cost when new M = Gradient X = Age in years
The formula for a negative gradient is Y = C - MX. This is because the formula for a positive gradient is Y = MX + C so it would be reversed.
Ford
Say you wanted to find out how much the Ford will be worth after 8 years.
Because the Ford starts at £7,900 and the gradient is 725 the formula would be shown as:
Y = 7900 - (725 x 8)
Y = 7900 - 5800
Y = 2100
Therefore the value of the car after 8 years would be £2,100.
Vauxhall
Say you wanted to find out how much the Vauxhall will be worth after 8 years.
Because the Vauxhall starts at £8,200 and the gradient is 750 the formula would be shown as:
Page 3
Y = 8200 - (750 x 8)
Y = 8200 - 6000
Y = 2200
Therefore the value of the car after 8 years would be £2,200.
Rover
Say you wanted to find out how much the Rover will be worth after 8 years.
Because the Rover starts at £5,800 and the gradient is 450 the formula would be shown as:
Y = 5800 - (450 x 8)
Y = 5800 - 3600
Y = 2200
Therefore the value of the car after 8 years would be £2,200
This table shows that after 10 years the Rover is valued the highest, despite being the cheapest to start with. So far this investigation is in Rovers favour showing that it is the best value car.
For mileage against price I have drawn another 4 graphs. 1 for each manufacturer as before.
The gradients for these graphs are:
Ford
The graph for Ford is a strong, negative correlation. The Ford becomes worthless when it reaches 126,000 miles. When the mileage is nothing the car is worth £7,900.
1300 / 2 = 650
This means that £650 is lost every 10,000 miles on a Ford car.
Vauxhall
The graph for Vauxhall is a very strong, negative correlation. The Vauxhall becomes worthless when it reaches 100,500 miles. When the mileage is nothing the car is worth £8,200.
Page 4
1600 / 2 = 800
This means that £800 is lost every 10,000 miles on a Vauxhall car.
Rover
The graph for Rover is a not very strong, negative correlation. The Rover becomes worthless when it reaches 145,000 miles. There is one odd point because the price of that car started very high. When the mileage is nothing the car is worth £5,800.
800 / 2 = 400
This means that £400 is lost every 10,000 miles on a Rover car.
To work out the formula for the price of a used car with a certain mileage I have used the same formula as last time.
Y = Answer C = Cost when new M = Gradient X = Age in years
The formula for a negative gradient is Y = C - MX. This is because the formula for a positive gradient is Y = MX + C so it would be reversed.
Ford
Say you wanted to find out how much a Ford car would cost after 80,000 miles
Because the Ford starts at £7,900 and the gradient is 650 the formula would be shown as:
Y = 7900 - (650 x 8)
Y = 7900 - 5200
Y = 2700
Therefore the value of the car after 80,000 miles would be £2,700.
Vauxhall
Say you wanted to find out how much a Vauxhall car would cost after 80,000 miles
Because the Vauxhall starts at £8,200 and the gradient is 800 the formula would be shown as:
Y = 8200 - (800 x 8)
Y = 8200 - 6400
Y = 2200
Therefore the value of the car after 80,000 miles would be £2,200.
Rover
Say you wanted to find out how much a Rover car would cost after 80,000 miles
Because the Rover starts at £5,800 and the gradient is 400 the formula would be shown as:
Y = 5800 - (400 x 8)
Y = 5800 - 4000
Y = 2600
Page 5
Therefore the value of the car after 80,000 miles would be £2,600.
The table below shows the value of each make of car after various mileages using the formula.
Looking at this table Rover is the best value car as it loses the least amount of money after every 10,000 miles. After starting off the costliest the Vauxhall is only worth £200 after 100,000 miles, which makes it the car that loses the highest value by far. Whereas the Rover starts off the cheapest and finishes the highest priced of the three manufacturers after 100,000 miles.
In this experiment I discovered that Rover is the best value car out of the three that I chose to investigate. Vauxhall was the worst value car because it lost the most money on age and mileage. Ford was almost as bad value for money as the Vauxhall. My investigation could be improved by including more manufacturers and their cars. Also because the graphs are not 100% accurate. In real life as soon as you drive a new car off the forecourt it drops in value instantly. This means the graphs should have looked more like