A table of results from people in my class:
Overall, when we tested the data on members in my class, it proved to be quite accurate, although the predicted heights were always smaller than the actual heights possibly because we have only tested the equation from the scatter graph on girls and the data that we were given was from a mixture of girls and boys. Perhaps to make it more accurate we could eliminate all the data for the boys so that the data is just from girls to see whether there is a more specific equation for working out the height for girls.
If we were to test that equation on boys we would need to choose boys whose height or foot size is within the range of the given data as it would be very foolish to predict someone’s height or foot size or to extrapolate data from it as it would not be accurate.
Refining Hypothesis
As a result of looking at the first scatter graph, I found that my data was possibly not accurate enough to come up with a definite equation and therefore was inconclusive because when I tested the equation for female members of my class to find out their height, I noticed that every time, the predicted height was always shorter than the actual height. I wondered if the r-value would increase if I was to calculate the correlation coefficient by gender i.e. complete a scatter graph for girls only and a separate graph for boys only. So now I am going to separate the genders and look at both genders independently to see if there is a more specific equation to work out the height and foot size for each sex. I think when I separate the gender; the correlation will be better than when both sexes are mixed because the data will be more similar and more accurate. I think that one of the correlations will be higher and the other lower and this may be the case because the overall correlation should be the average of two. At this moment I do not know which way around it will be as it depends on the age group of the pupils analysed.
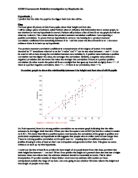
A scatter graph showing the relationship between height and foot size for just male pupils
This scatter graph only shows the heights and foot sizes of the boys. As I previously expected, there is a strong positive correlation as for this graph the r-value is 0.860 (square root of 0.74). Evidently, this r-value is a better correlation than the original one, meaning that the equation is more accurate to work out the height or foot size of a male. This might be because they may have stopped growing and therefore their feet and height are in a better proportion. Within this scatter graph there are a few anomalies. For example, there is a boy whose foot measures only 24cm and has a height of approximately 180cm, which is almost 30cm taller than that which the line of best fit predicts. As before, looking at the data for males only, I can see that there is a very high positive correlation, which means that long footed males will tend to be tall. The value for the coefficient is higher than for mixed gender, which concurs with my hypothesis.
Now I am going to repeat the same process to find a better equation to work the height and foot size for female pupils, although this suggests that the relationship for females should be weaker. I will plot a scatter graph for females only and see if this is true.
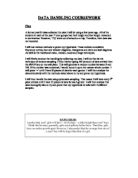
A scatter graph to show the relationship between height and foot size for just female pupils
This scatter graph only shows the heights and foot sizes of the girls. As I previously expected, there is a strong positive correlation as for this graph the r-value is 0.812 (square root of 0.66). I am surprised to find out that the r-value is lower than the original one, meaning that the equation above is less accurate than the equation to work out the height and foot size for both genders. To improve this equation, I am going to remove any anomalous results portrayed in this scatter graph as the relationship here is slightly weaker for females than for males. This may be the case because the females are still growing and therefore there feet have not grown as fast as their height or vice versa. I will remove the anomalies that are circled as in my opinion those are the furthest away from the line of best fit.
When I took away the two anomalous results (next page), it made no significant difference and on that basis, there is no point in using this equation because if the correlation were the same, I would expect similar results. I should just use the equation for both genders, because it is very alike to use it for the females.
A scatter graph to show the relationship between height and foot size for just female pupils with two anomalies taken away
Hypothesis 2
I predict that the male pupils will be taller than the female pupils as I think that the boys in the class will generally be taller than the girls. I think this is the case because men are generally taller than women.
Plan
To analyse this statement above, I will use Fathom to draw box plots. I will test this hypothesis by comparing the median heights for boys and girls. Hopefully by transferring this data into box plots, it will be easier to find a trend when comparing the two. To prove that my hypothesis is correct I am expecting that the median and mean will be higher for the males.
Box plots and summary table showing the heights of female and male pupils
So to make things easier, here is a table of everything covered:
From these box plots and summary tables, I can see that the range of male heights is greater than the females, this shows that the males’ heights are more varied and are not concentrated around a specific height whereas females are much more compact. The mean height for the female is about 30mm more than the mean height for the males; this was not what I expected and suggests that my hypothesis is inaccurate. The female interquartile range is also a lot smaller than the male showing that my earlier point that females are more compact is accurate and the male pupils are more spread out. The median height for boys is 147cm whilst that for girls is 146cm. This suggests that there is some evidence to support my hypothesis and I can infer in general some males tend to be taller than females but the box plots are too similar to draw a stronger conclusion. Furthermore, the standard deviation for males is higher than the females which mean that males are more spread out. Standard deviation is a statistical measure of spread of results. The standard deviation is a measure of variability expressed in the same units as the data. The standard deviation is very much like a mean of these deviations.
So to conclude I think that for this class, the females are generally taller than the males because if I was to just look at the tow averages for both genders, the average for the female students is higher so therefore
Hypothesis 3
I predict that the male students will have a bigger foot size than the female pupils. I predict this because from my previous results male pupils have generally shown to be the bigger out of the two genders.
Plan
To analyse this hypothesis, I will repeat the process but this time I will use Fathom to draw box plots and test this by comparing the foot lengths for female and male pupils to see if I can come to a conclusion about whether my hypothesis is accurate or not. To prove that my hypothesis is correct, I will want a larger mean and median from the gender.
Box plots and summary table showing the foot sizes of female and male pupils
So that I can make clearer distinctions for patterns and trends, here is a table of everything covered:
From the above box plots and summary tables, I can say that the median foot length for males was 23cm and that for girls was also 23cm. This suggests that there is no evidence to support my hypothesis and I can infer that in general, males have similar foot lengths to females; this also leaves my hypothesis inconclusive. I can also see that the spread of females (the interquartile range = 4) is slightly smaller than the spread of males (the interquartile range= 5). This indicates that some females have very similar size feet whereas some males have very different size feet and also this pattern can be linked back to the heights as there was more males spread out whereas the females were all quite close together. This trend re-emerges here as well and this includes the range of the foot sizes for each gender too because once again the standard deviation for males is higher than it is for females and the higher it is (the closer it is to the mean), the greater the spread of data.
Conclusion
I was given 60 pieces data on pupils’ heights and foot sizes from a school then I investigated the relationship between the foot size and height put placing all the provided data in a scatter graph. Next to make my equations more accurate, I separated the genders and investigated foot size and I found out that there was a better equation for males but I couldn’t get one for females. From my results, generally males had a wider range and was taller and had a bigger foot length than females although I cannot be sure and will need to do further testing.
If I were to re-do this investigation I would like to investigate the age of the pupils from who I have received the data. I think this would have made my investigation better because it would give me some clues to why I got the trends that I got. It could also affect my hypothesises. I would extend the number of pupils I used in this investigation so that I got a wider range of data and may give us more accurate views of the relationships for example something like 600 pieces of data would be significant to draw up conclusions whereas now, as far as my hypothesises are concerned, they are inconclusive and I can’t make a judgement about whether their correct or not. In addition, I would like to remove any anomalies and see how this affects the value of r. This may mean that my r-value goes up.