I will investigate these following hypotheses using my sample of data:
Hypotheses
- Year 8 females will be taller and heavier than year 8 males.
- Year 11 males will be taller and heavier than year 11 females.
- Year 8 males will be taller and heavier than Year 7 males but shorter and lighter than Year 11 males.
- There is a positive correlation between height and weight.
I have chosen these hypotheses according to my experiences, general knowledge and what I have seen. Scientific research shows females reach maturity earlier than males. Also females usually have a greater weight and height during the years 12-14. Males reach maturity between the ages of 14-16 and Year 11 males have already matured and have started their growth spurts. Due to this development the height to weight ratio is greater in Years 7 and 8 for females rather than males. But Years 9-11 males have a greater height to weight ratio than the females.
To prove that my hypotheses are correct I will draw these diagrams:
- Histogram- my data is continuous and will be grouped. The shape will affect the measure of average and dispersion to be used. The mode can be estimated from this diagram.
- Cumulative frequency curve- for the height and weight will change the cumulative frequency as the data greatens. I will be using box and whisker plots to make in parallel to make it easier. I will be using the skewness.
- Scatter graph- to show the connection between the heights and weights across the gender divide so to show the quality of the correlation. I will use different graphs for male and female. The scatter graph can help me make estimates about height and weight by using the line of best fit.
I will calculate the mean, median, mode, interquartile range and standard deviation to find differences and similarities between the years. I will use this data to estimate the height to weight ratio. The standard deviation will show the dispersion.
From my random sampling I had a few outliers. They were:
These pupils either were too short or tall or too light or heavy. They were not used and they were replaced with pupils with no outliers.
Hypothesis 4
- There is a positive correlation between height and weight.
To create the graphs I must produce tables of the data in excel and use it to make a graph.
Males
As you can see there is a positive correlation for all of the males.
Females
As you can see there is a positive correlation for all of the females.
All Students
As you can see there is a positive correlation for all of the students.
Hypothesis 1
- Year 8 females will be taller and heavier than year 8 males.
The median of yr 8 males weight was 43.9 kg and females was 50.6kg. This suggests that females are heavier than males. This agrees with my hypothesis. However the median for height was for males 1.545m and females was 1.575m. This indicates that females are taller.
My box plots show the LQ of males is for height and weight is 1.465m and 38.4kg and female height and weight were 1.495m and 48.2kg. This is greater for females also. The UQ of males for height and weight is 1.615m and 48.6kg. The UQ for female’s height and weight was 1.665m and 51.2kg. From this I can assume that my hypothesis is correct.
I still believe that my hypothesis is correct but I can see how students can control there weight but not height.
Hypothesis 2
- Year 11 males will be taller and heavier than year 11 females.
The median of yr 11 males weight was 57kg and females was 54.8kg. This suggests that males are heavier than females. This agrees with my hypothesis. However the median for height for males was 1.685m and females was 1.64m. This indicates that males are taller.
My box plots show the LQ of males is for height and weight is 1.5295m and 33.6kg and female height and weight were 1.6175m and 45.1kg. This is greater for males also. The UQ of males for height and weight is 1.73m and 61.2kg. The UQ for female’s height and weight was 1.815m and 60kg. From this I can assume that my hypothesis is correct.
I still believe that my hypothesis is correct but I can again see how students can control there weight but not height.
Hypothesis 3
- Year 8 students will be taller and heavier than year 7 students but shorter and lighter than yr 11 students.
We already know the details for yr8 and 11 so I shall only do yr 7 and then compare them. The median of yr 7 males weight was 43kg and females was 41.6kg. This suggests that males are heavier than females. However the median for height was for males 1.541m and females was 1.55m. This indicates that females are taller.
My box plots show the LQ of males is for height and weight is 1.462m and 38.4kg and female height and weight were 1.49m and 37.1kg. This is greater for males now. The UQ of males for height and weight is 1.624m and 49.7kg. The UQ for female’s height and weight was 1.585m and 44.1kg.
From all the results you can immediately tell that year 8 students will be taller and heavier than year 7 students but shorter and lighter than yr 11 students. It is common sense to know that this is true and I have just proved it.
I still believe that my hypothesis is correct but I can see how students can control there weight but not height.
Hypothesis 4
- There is a positive correlation between height and weight.
You can see from above when I made the graphs that for males, females and all the students put together they had a positive gradient. The equation for the line of best fit clearly shows a positive gradient thus therefore there is a positive gradient.
This shows that my hypothesis is correct.
Percentage Error
To calculate the percentage error the formula is Cumulative median . This is
Raw data median
how I shall calculate the percentage error. I shall only work it out for the years that I have done which are Yrs 7, 8 and 11.
Yr 7 Males Height
Cumulative median = 1.541m
Raw data median = (13+1) = 1.52m
2
Percentage error = 1.013815789
Yr 7 Females Height
Cumulative median = 1.55m
Raw data median = (11+1) = 1.52m
2
Percentage Error = 1.019736842
Yr 7 Males Weight
Cumulative median = 43kg
Raw data median = (13+1) = 40kg
2
Percentage Error = 1.075
Yr 7 Females Weight
Cumulative median = 41.6kg
Raw data median = (11+1) = 40kg
2
Percentage Error = 1.04
Yr 8 Males Height
Cumulative median = 1.545m
Raw data median = (12+1) = 1.6m
2
Percentage Error = 0.965625
Yr 8 Females Height
Cumulative median = 1.575m
Raw data median = (11+1) = 1.58m
2
Percentage Error = 0.996835443
Yr 8 Males Weight
Cumulative median = 43.9kg
Raw data median = (12+1) = 50kg
2
Percentage Error = 0.878
Yr 8 Females Weight
Cumulative median = 50.6kg
Raw data median = (11+1) = 50kg
2
Percentage Error = 1.0
Yr 11 Males Height
Cumulative median = 1.685m
Raw data median = (7+1) = 1.68m
2
Percentage Error = 1.00297619
Yr 11 Females Height
Cumulative median = 1.64m
Raw data median = (7+1) = 1.62m
2
Percentage Error = 1.012345679
Yr 11 Males Weight
Cumulative median = 57kg
Raw data median = (7+1) = 57kg
2
Percentage Error = 1.0
Yr 11 Females Weight
Cumulative median = 54.8kg
Raw data median = (7+1) = 54kg
2
Percentage Error = 1.004814815
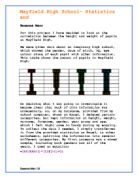
Standard Deviation
I will do standard deviation for all the males, females and then every student. The standard deviation will show the dispersion. The formula for standard deviation is:
Σ (x –m) 2 Σ = Sum of
x = Height/Weight all added up
Σ F m = mean
2 = squared
F = frequency
Males Height
Frequency = 51
Mean = 50.8627451
Sum of (mean – height) squared =
Standard Deviation =