For this I will use:
- Scatter graphs and lines of best fit. - To visually show correlation.
I will then continue my investigation with my third hypothesis:
The IQs for non blonde girls and blonde girls are normally distributed.
For this hypothesis I will have to see if the girls IQ is evenly distributed. For this I will need to construct 2 histograms and see if they follow the “bell shaped” pattern. I will then investigate the requirements for a data to be classed as having normal distribution which are as follows:
The mean must be in the centre of the histogram.
68% of the data must fall within 1 standard deviations of the mean.
95% of the data must fall within 2 standard deviations of the mean.
99.7% of the data (almost all) must fall within 3 standard deviations of the mean.
Normal distribution is mathematically absolute in that it either it is or it isn’t and so I should have no trouble in determining the result and coming to a definite conclusion.
DATA ACQUISITION
RAW DATA
I used stratified sampling so as to get a better spread of girls from the different year groups. I decided in my plan to take a sample size of 50 of each hair type.
Calculations:
KS3 = 399 girls KS4 = 181 girls Total = 580 girls
399 x 50 = 34 (34.39 rounded from34.39 )
580
181 x 50 = 16 (rounded from 15.6)
580
Once I had my sample size I began to take my sample. It was then that I began to notice a problem. My hypothesis dealt with blondes against non blondes which is absolute, eg. Your either blonde or you aren’t. However it seems that the question poised on the survey was not a good one for my hypothesis. Rather than dealing with objective data eg. blonde, brunette etc it seems to have been an open ended question and has therefore become something subjective e.g “mousy blonde” or “browny blonde”. As my hypothesis dealt in two sets of data they had to be grouped. This poised the question:
What defines blonde?
I have defined the following as blonde (the rest were classed as non blonde.)
- Baby blonde
- Blonde
- Blonde/ Brown
- Brown/ Blonde
- Browny Blonde
- Dark Blonde
- Darke Blonde
- Honey Blonde
- Strawberry Blonde
I have chosen to include spelling errors to some extent as it is clear as to what the participant intended and miss spelling doesn’t change what hair colour they have.
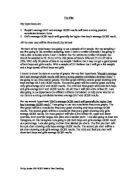
- HYPOTHESIS 1 - Blonde girls are more intelligent than non blonde girls.
From the above graph we can see that the Non Blonde IQ Range Box plot has a considerably longer range than the Blonde Girls Equivalent. We can see that the range drops to around 10, an unrealistically low IQ. Therefore I applied the IQR method to determine if this is an outlier as well as to determine if any others are which could effect my results...
IQR method (Blonde Girls):
Range 43
Lower Quartile: 96.5
Median: 101
Upper Quartile: 106.25
Therefore: The IQR = Q3 (Upper Quartile)-Q1 (Lower Quartile) = IQR = 106.25-96.5
= 9.75 x 1.5 = 14.625
Every value within Median (+/- 14.625) is not an outlier.
Therefore: 101-14.625 = 86.375 101+14.625 = 115.625
Therefore: The Range that are not mathematical outliers are:
From 86 to 116 (rounded to whole numbers)
Outliers:
74
IQR method (Non Blonde Girls):
Range, x: 121
Lower Quartile: 94
Median: 100
Upper Quartile: 110
Therefore: The IQR = Q3 (Upper Quartile)-Q1 (Lower Quartile) = IQR = 110-94
= 16
Every value within Median (+/-16) is not an outlier.
Therefore 94-16 = 78 110+16= 126
Therefore the range that are not mathematic outliers are from 78 to 126
Outliers:
11, 72, 132
I will remove these outliers from my sample as my Hypothesis deals with IQ generally. These special cases must be removed because they drastically change the data itself and cause an inaccurate picture of the statistics to be drawn.
I have also taken away 3 other values from the Blonde data as well as another from the Non Blondes as one member of the survey claimed to watch 100000 Hours of television a week. I have done this so that all of the sample sizes are consistent and this will be beneficial when I come to my second hypothesis, where I will again need equal sample sizes.
DATA SHEET (FINAL)
With the new data the graph looks like this.
INTERPRETATION
GRAPH 1
From the above graph we can quickly see that the Non Blondes have a far greater range of values whereas the Blonde Girls have a relatively compact set of statistics. Also the entire graph, excluding outliers is in terms of medians, quartiles and ranges is shifted in the Blondes favour slightly to the right. However although Non Blonde Girls’ Upper Quartile has a far greater range, they are “let down” by their lower quartile which is comparatively lower than the Blondes. Therefore because the Blonde Girls are more consistent in that although they have a smaller range they do not have a low 50%. As a result of this, according to this set of data I interpret that although there is very little difference between the two sets of values Blonde Girls are more consistent with their IQ and because their box plot is more to the right I believe that this graph shows that Blonde Girls are more intelligent than Non Blondes.
GRAPH 2
From this graph we can see visually that the Non Blondes are very consistent with IQ and evenly spaced but if we analyse the Blondes we see that (in terms of Non Blondes) at the higher end they over perform and at the lower end they under perform. Therefore there is no definite conclusion as the hypothesis deals with the groups generally rather than at different levels of ability.
GRAPH 3
From this graph we see that the mean (thicker lines) is higher for Blondes than None Blondes. We can also see that by using the Standard Deviation which measures spread, that the Non Blondes data is more ranged. This is mathematical proof to the visual already displayed on graphs 1 + 2. The conclusion that we can draw from graph 3 is that the average Blonde is more intelligent than the average Non Blonde.
HYPOTHESIS 2
Blonde girls that have a higher IQ watch comparatively less television. This will not be the case however for non blondes as there will be little or no correlation.
INTERPRETATION
GRAPHS 1 + 2.
From Graph 1 there is a very weak positive correlation. From graph 2 there is no correlation. Graph 1 suggests that (particularly in the upper boundaries) that more intelligent people watch more TV. This means that my hypothesis was half correct in that I expected no correlation for Non Blondes but one for Blondes. However this part of my Hypothesis was wrong.
I then continued my investigation with:
The IQs for non blonde girls and blonde girls are normally distributed.
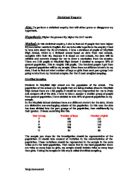
For this I will need to produce 2 histograms and see if the required % of data falls into the relative amounts of standard deviation.
fr
IQ
IQ
GRAPHS 1+2.
Both the Blonde and Non Blonde IQs do not have normal distribution. I know this because the mean (the thick blue lines along the x axis) is not in the central point of the frequency polygon. Also some of the data is not even in some of the 3rd Standard deviations of the mean making it impossible for the data to be normally distributed. This means that my Hypothesis was wrong.
CONCLUSION
HYPOTHESIS 1
- Blonde girls are more intelligent than non blonde girls.
I found that Blonde girls have the higher range (rather than Non Blondes who have the biggest). Blonde girls also have a larger amount of values in the middle 50% in the IQ range but Non Blondes in terms of the higher rung so to speak out perform them. However non Blondes also under perform at the lower end of the scale. This means that although Blonde girls are more consistent with their IQ it is impossible to determine which set of data is more intelligent because my hypothesis is a general statement. However the mean, as crude as it is shows that the average Blonde is more intelligent than the average Non Blonde and therefore I would agree with my Hypothesis in that Blondes (only on average) are more intelligent than Non Blondes.
HYPOTHESIS 2
- Blonde girls that have a higher IQ watch comparatively less television. This will not be the case however for non blondes as there will be little or no correlation.
I found here that there was a very weak correlation with Blonde IQ vs TV scatter graphs but unlike my hypothesis it seemed that more intelligent people watched more TV. There was also, (in my opinion) no correlation between the Non Blonde IQ vs TV scatter graphs. I therefore (although the correlation is a weak one) have disproved my hypothesis and have come to the conclusion that:
More intelligent Blondes watch more television but there is no correlation with Non Blondes.