- An estimate for the price of the next car that comes into the garage
- If you wanted to estimate how much the car will cost after a few years.
To see weather the equations are correct or not I will do examples by substituting the certain factors into the equation.
To make sure that the information is reliable, I am going to check and compare the data using information from the Internet and auto-car magazines.
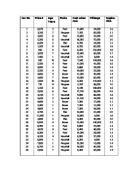
Data for the car sale
The following graphs show the three different correlations. Engine size vs. Price has a positive correlation, mileage vs. Price has a negative correlation and Age vs. Price has a negative correlation. The ones that are circled red are the outliers. An outlier is a piece of data that does not fit in with the rest of the data; it is obvious to notice because it looks odd. The three other graphs that do not have red circles on them are the same but only this time they don’t have the outliers included on them. Outliers are considered not to be on graphs because they affect the steepness of the line of best fit.
Equations for the three graphs
I am going to be basing my equations on this y = mx + c
Engine Size;
-
Mx = 2.2/5000= - 0.00044
-
C = 600
-
Y = -0.00044x + 600
Example ;( Ford Orion)
-0.00044 * 1.8 + 600 = 600
Mileage;
-
Mx = 20/1250 = 0.016
-
C = 3800
-
Y= 0.016x +3800
Example (Ford Orion)
0.016 * 7000 + 3800 = 3912
Age;
- Mx = 7/5000 = -0.0014
- C = 8000
- Y= -0.0014x + 800
Example (Ford Orion)
-0.0014 * 1 + 800 = 800
I am now going to combine all three equations together and divide them by three to get an average for the price
- Mx= 0.00044 + 0.016 + 0.0014
= 0.01784/3
= 0.0059
= 12400/3
= 4133.33
I am now going to see whether the equation is correct
- 600 + 3912 + 800 = 5312
- 5312/3 = 1770.67
-
0.0059 * 1770.67 + 4133.33 = 4144
Therefore the estimated price for the Ford Orion is £4144. The original price is £7999.
Evaluation
I found out that my hypothesis agrees with the results of my investigation. In my hypothesis I stated that the engine size vs. the price will have a positive correlation, and that the mileage and the age vs. the price would both have a negative correlation. I was correct because when I did the three graphs that was exactly what I predicted.
The equations that I came out with were only an estimate of what the price could be. The original price of the Ford Orion was £7999. When I combined all three equations together, added them up, divided by three and then substituted the example into the equation the price resulted into being £4144. In my opinion I think that it is impossible to work out equations for the three graphs and an average for the price even if you based it on the equation y= mx + c. The equations are always going to be an estimate; they can not be definite equations that give you completely accurate results.
To improve the procedures of my ‘Car Sales Project’, I would like to do graphs for every piece of data including every car on the table. This will enable me to have a wider range of results and more accurate data and graphs. Another area of improvement I think is to do more examples so that I can compare between them and so that I am not depending on only one or two examples. The more examples, the more evidence you have with you. I would also like to keep trying to come out with correct equations that definitely work.