Then I will go on to investigate how mileage effects depreciation. I will do this to try and see if mileage has a larger bearing on depreciation than age does. I will do another line graph. If it is straight, I will repeat what I plan to do earlier about the equation of the straight line. I will also do an example to show my results.
I will then make a cumulative frequency table on depreciation per one thousand miles. With this I can work out the mean, median and mode.
I will also make a cumulative frequency graph with which I can show the upper and lower quartiles, the median and the inter quartile range.
I will also do a stem and leaf diagram. This will show how a specific make depreciates depending on one thousand miles. This will demonstrate the spread of the makes depreciation.
I will investigate to see if colour affects the depreciation of a car. I will do this using pie-charts. I will use pie-charts because the right colours can be represented and is very visually and easily read.
I will finish with a straight line graph showing the direct correlation between the largest factor I find and depreciation.
Prediction
I predict that regarding all factors on the cars, they will depreciate on a sharp curve; faster in the first 1-3 years and then slow down to a slow average depreciation. I think that the age will be the most influential aspect of the depreciation followed by the mileage. I think this is because after these the car starts to stop working as well. I think that the colour will not affect depreciation a lot but also that some cars will not depreciate that fast just because they are of a certain make which is well respected as a good manufacturer.
Results
Investigating how age affects depreciation
#
The line on this graph is a curve showing the average values of the depreciation per year of all cars.
Investigating depreciation for a specific age
In this part I am looking at all makes depreciation for a specific age. I have chosen to only look at 6 year old cars to make the investigation fair. I chose 6 year old cars because it gave the largest sample.
The mean depreciation for these cars is:
1254
.’. the mean value of the depreciation of 6 year old cars is 66%
I can also find the mode for these values. The are two most common values; 72 and 88
The median for these values is:
The middle number is 71 so that is the median of these numbers.
The range is also relevant. Despite all being 6 year old cars the values vary from 41 to 88 giving a range of 47
Investigating depreciation for different age brackets
Investigating how different makes depreciate
Investigating how differences between similar cars affect depreciation
Investigating technology of cars
Investigating how mileage affects depreciation
Investigating depreciation per 1000 miles
To use this to estimate the mean you use this formula:
Mean= overall total
Frequency total
185
98
.'. The mean depreciation per 1000 miles is 1.89%
To get the median you take the middle value:
98 =49
2
Go to 49 on the cumulative frequency column
This falls on the 1<x<2 group so that is the most accurate median you can give.
The mode is obtained by the column with the highest value which is 1<x<2 with a frequency of 68.
(this will be drawn in by hand)
This shows that the:
Lower quartile is -------1.47
Median is --------------- 1.59
Upper quartile is --------1.98
Range is ----------------- 7
Inter-quartile range is---0.51
Investigating how ford cars depreciate with mileage.
1
2
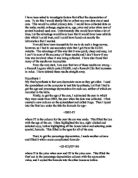
This stem and leaf diagram shows how fast Ford cars depreciate (according to mileage). It shows that most Ford cars depreciate between 1 and 2 percent per 1000 miles and at an average of 1.42 % per 1000 miles where as the average for all cars is 1.97%.
Investigating how colour affects deprecation
Pie-chart to show percentage of colours with above average depreciation
(A pie chart will be drawn by hand here)
Pie-chart to show percentage of colours with below average depreciation
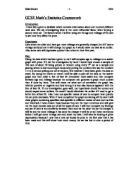
This graph directly shows the correlation between age and used car price. It indisputably shows that as age increases, the cars price decreases. For this comparison I have omitted cars above £10,000.
Evaluation
In this piece of coursework I was asked to look at what affects the price of a second hand car.
When I looked at how age affects depreciation it produced a curved line rather than a straight one. This was steeper for the first two years.
The box plot shows that the average car depreciates by half in the first 1.69 years but it loses its value by a quarter in less than half a year.
Looking at the depreciation for a specific age, this proved the chart with six year old cars depreciating by 66%.
The histogram shows that a middle aged car depreciates at 12.34% per year where as newer cars have a significantly increased rate.
The pictogram shows how different makes of cars depreciate by different amounts across their life. Mercedes depreciate at only 31% which is less than half the depreciation of a Citroen at 80% depreciation.
I then found that when looking at similar cars colour played a large impact on certain cars. This was because it was part of a trend which was no longer fashionable.
The technology table shows that technology does not have a big impact on its own but lack of technology is coupled with an older car.
The mileage line graph showed a moderate positive correlation. It was a straight line and therefore was able to get the equation: Y=1.6><-59
This can be used to find the average depreciation given the mileage of a car.
I then calculated that the mean depreciation per 1000 miles was 1.89% but the range was very large.I looked then at only Ford cars using a stem and leaf diagram. This shows that most Ford cars depreciate between 1 and 2 percent per 1000 miles and at an average of 1.42 % per 1000 miles.
The pie-charts show that black and silver cars have more cars below average depreciation than any other colour which means that they depreciate slower compared to red which has a lot of cars with above average depreciation.
The graph showing price against age was chosen as I found that this was the largest factor of depreciation on the cars. It indisputably shows that as age increases, the cars price decreases.
Summary
I have found that there are many different aspects which are factors in cars depreciation. The first and most obvious is the age. This, I found is the most important aspect coupled closely with mileage. All other factors are relevant but do not play as big a part. Anomalies occur such as some makes, e.g. Mercedes are renowned as good cars and are less likely to depreciate. Equally there are some car colours which go out of fashion and cause them to depreciate faster than others.
I also found that I was accurate with my prediction: there is a curving incline with depreciation and in the first 1-2 years it is at its highest rate before levelling out.
I was wrong thinking that colour plays no part in depreciation, which I have now found does, as colours such as black or silver don’t depreciate as fast as other cars.
I think that if there were more cars then it would make the evidence more analysable but this amount is enough to get a general idea. I also think that the data could be unfair because for some makes there were only one or two cars which I could use. Because of this, I could not be certain that they were accurate for that make.