I will select at random 30 boys and 30 girls from year 7 to year 11 and make a chart about the students heights and weights.

Authors Avatar

Data Handling Coursework

Introduction

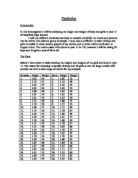
In this coursework I have been given the data about the weight and heights of boys and girls of Mayfield high school. I will select at random 30 boys and 30 girls from year 7 to year 11 and make a chart about the student’s heights and weights.

 My Hypothesis is as follows:


  1. The boys of year 11 are heavier then the girls in year 11.

  1. The boys of year 7 are lighter then the girls in year 7.
Join now!

  1. The boys of year 9 there will be taller then the girls in year 9.

To prove my hypnotises I will draw bar charts, pictograms, histograms, frequency polygons, cumulative frequency graphs, box and whiskers and stem and leaf diagrams.    

Data


Data


Tally chart

Boy’s weights

Girl’s Weights

Boy’s Heights

Girl’s Heights

Cumulative Frequency

Weight in year 7


This is a preview of the whole essay