The software I require is Microsoft Excel, a spreadsheet package. I am going to use this as it can be used to do many calculations automatically, and I am familiar with the package.
The sources of input data for this product are as follows:
- The price the customer buys cards for;
- The price the cards cost to buy into stock;
- The code numbers of each of the cards;
- The number of cards bought and sold.
It is important to know the price that the customers buy the cards for, as this is used to calculate the total income. The price the retailer pays for the cards is important, as the total expenditure needs to also be calculated. These two sources are then used together to calculate the profit/loss. The code number of the cards is important, as when it is used in the spreadsheet, it makes looking up the prices of individual cards much quicker and easier.
This data is going to come the company website. The code numbers and prices are listed here. They can also be accessed by looking at the customer and retailer order forms.
I am going to collect this data, and manually enter it into the spreadsheet.
The computer will process the data as follows:
Therefore my output data is:
- Total Cards Sold
- Total Cards Bought
- Profit Margin
- Total Number of Cards In Stock
This output data will be printed once per week, showing the profits/losses.
The user, with the use of a floppy disk, will back up the spreadsheet. It will be backed every time the spreadsheet is altered.
The user has asked, for extra security, that the spreadsheet is password protected.
Test Plan
Implementation
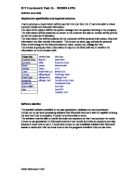
With the use of Microsoft excel, a spreadsheet package, I entered each individual card into a spreadsheet, with its code number, price sold for, price bought for, number bought, and number sold, as shown below:
From this data, the profit per card, number left, and total profit per card can be calculated, as shown here:
This data is created using the following formulae:
My first objectives were to produce a total for the number of cards bought, and the total number of cards sold. I put this data on a fresh sheet in the spreadsheet, so that it is easy to view:
Also, a total for the number of cards left in sock was asked for, and total profit, which is also calculated on this sheet, as seen above.
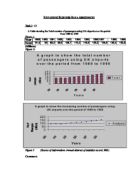
To be able to look up individual cards by code was the next objective. For this I decided to use a V-lookup table, where data (i.e. the code) is entered into one cell, and then other information is shown in other cells. Below is the table that I created to do this, again on a fresh sheet, so that it was easy to access:
This box appears when the cell is highlighted giving the user instructions, making it clearer and easier.
Here are the formulae used to make this table work correctly:
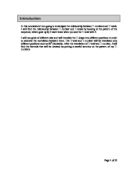
I was also asked to include the company logo on the spreadsheet, with a hyperlink to the company website:
Here you can see the company logo that I included in the spreadsheet, as was requested. I have hyperlinked this logo to the company website, as the small box underneath shows. When you click on it, it will take you directly to the homepage of the company website.
I have password protected the cells in this spreadsheet, to prevent the data being changed by unauthorised people:
The image shows that you must enter a password to unprotect the sheet, before changing any of the data within the cells.
I am now going to test all of these objectives.
Test 1
As the number ordered increases
by one, the total bought also
increases by one.
This result means that this function has worked.
Test 2
As the number of cards sold increases by one, the total number of cards sold also increases by one. Therefore this function works.
Test 3 and 4
As you can also see in the tests above, by changing the number bought, or sold by one, the total number of cards left in stock changes respectively. The total profit also changes, as more cards are bought (total decreases), or more cards are sold (total increases). This therefore shows that both of these to functions work correctly.
Test 5
The code is entered into the box…
…and the details of the card are shown.
This result shows that this test works correctly.
Test 6
Here you see the company logo. When I click on the logo…
…the homepage of the company website appears. Therefore this function works correctly.
Test 7
When you try and edit the data in any of the cells, this box appears…
You then need to enter a password to unlock the cells…
Once the correct password is entered…
…the data in any cell can then be changed. If the password is not correct, this box appears:
Unless the correct password is entered, no data in any of the cells can be changed.
This therefore shows that this function is working correctly.
I can now fill in the last column of the Test Plan:
Evaluation
I was asked to include in the spreadsheet the following things:
- It must be able to produce a total for cards sold;
- It must be able to produce a total for total cards bought;
- It must be able to produce a total for profit/loss;
- It must be able to show how many cards are in stock;
- It must be able to look up individual cards;
- It must include the company logo, and hyperlink to the company website;
- It must allow a page, showing profits/losses to be printed out;
- It must be password protected for extra security.
I have successfully met each of these objectives in this project. Totals for cards sold, cards bought, profits, and cards in stock are now created automatically. They values change as data in the spreadsheet is changed. Individual card details can be looked up quickly and easily, and the company website can be accessed directly from the spreadsheet with the use of the hyperlink that I included. It is also password protected, so that no data can be changed without a password being entered first, meaning that it cannot be changed in anyway by unauthorised persons.
The user, my mum, sent this letter, giving her thoughts on the spreadsheet:
Dear Sam,
I have been using the spreadsheet that you created for a week now, and I must say that it is a success. All of the functions that I asked to be included are include in it, and they all work correctly.
Much time and energy is saved by using the spreadsheet, as I can access all the data that I need quickly and easily, meaning that the business can run much more efficiently.
I would like to thank you again for all the work that you have done for me.
Regards,
Mrs A C Coley
Now that I know this project has been successful, I can maybe improve it, or add additional features, to make it even better. For example, the layout could be improved, and macros could be included to clear the contents of cell more easily. I can also extend this project by making it automatically create graphs of monthly or weekly profits, so that the progress of the company can be monitored visually. If the user, my mum, asked for any other features to be added in the future, I would also be able to include these. My personal objective was to help my mums business run more efficiently, and I think that with this project, I have achieved my goal.