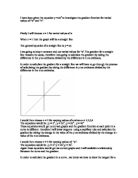
Gradient of straight line graphs= coefficient of x
Quadratic graphs
Quadratic graphs have the formula y= ax^2 or y= ax^2+bx+c where a and b are constants. These graphs are curved and u-shaped. The are usually called parabolas. To find the gradient, using a capillary tube a tangent should be drawn at least 3 points on the curve. From the tangent, the gradient should be calculated using the equation gradient=increase in y-axis /increase in x-axis.
Small increment method
In order to prove that my result are right, will any point on the graph that I have drawn tangent at and draw chords from several points such as x=2.01 and x=2.001 and x=2.0001. I will find the gradient of these chords using the general formula gradient=increase in y-axis /increase in x-axis.
Gradient calculations
1.y= x^2 graph
Gradient when x= 1 = increase in y-axis/increase in x-axis
= 2/1.1
=1.8
=2
Gradient when x= 2 = increase in y-axis/increase in x-axis
= 4/1.1
=3.49
=4
Gradient when x= 3 = increase in y-axis/increase in x-axis
= 6/1.1
=5.8
=6
Therefore for y= x^2: -
Gradient when x= 1= 1.8
Gradient when x= 2= 3.49
Gradient when x= 3= 5.8
Small increment method
At x= 2
2.y= 2X^2 graph
Gradient when x= 1 = increase in y-axis/increase in x-axis
= 4/1.1
=4.8
=4
Gradient when x= 2 = increase in y-axis/increase in x-axis
= 8/1.1
=7.8
=8
Gradient when x= 3 = increase in y-axis/increase in x-axis
= 12/1.1
=11.8
=12
Therefore for y= 2x^2: -
Gradient when x= 1= 3.80
Gradient when x= 2= 7.80
Gradient when x= 3= 11.80
Small increment method
At x= 2
3.y=1/2x^2
Gradient when x= 1 = increase in y-axis/increase in x-axis
= 1/1.1
=0.80
=1
Gradient when x= 2 = increase in y-axis/increase in x-axis
= 1/1.
=1.60
=2
Gradient when x= 3 = increase in y-axis/increase in x-axis
= 4.5/1.1
=4.3
=3
Therefore for y=1/2x^2: -
Gradient when x= 1= 0.45
Gradient when x= 2= 1.60
Gradient when x= 3= 4.3
Small increment method
At x= 2
Conclusion
From going over the calculations I conclude that the gradient of the quadratic graphs depends on the point the tangent drawn at and therefore these graphs have different gradients at different points. For example in the y= x^2 function when x= 1 the gradient is 4 but when x= 2 the gradient is 8. This shows that Quadratic function graphs have different gradients at different points.
Gradient of Quadratic functions depends on the point the tangent is drawn at.
Cubic graphs
Cubic graphs are graphs with the equation y= ax^3 or y= ax^3=bx+c.
Gradient calculations
1.y= x^3 graph
Gradient when x= 1 = increase in y-axis/increase in x-axis
= 3.4/1.1
=3.09
=3
Gradient when x= 2 = increase in y-axis/increase in x-axis
= 12/1
=12
Gradient when x= 3 = increase in y-axis/increase in x-axis
= 27/1
=27
Therefore for y= x^3: -
Gradient when x= 1= 3.09
Gradient when x= 2= 12
Gradient when x= 3= 27
Small increment method
At x= 2
2.y=-x^3 graph
Gradient when x= 1 = increase in y-axis/increase in x-axis
= 3.4/-1.1
=-3.09
=-3
Gradient when x= 2 = increase in y-axis/increase in x-axis
= 12/-1
=-12
Gradient when x= 3 = increase in y-axis/increase in x-axis
= 27.5/1
=27.5
Therefore for y=- x^3: -
Gradient when x= 1= -3
Gradient when x= 2= -12
Gradient when x= 3= 28
Small increment method
At x= 2
3.y= -x^3+1 graph
Gradient when x= 1 = increase in y-axis/increase in x-axis
= 2.5/-1
=-2.5
=-3
Gradient when x= 2 = increase in y-axis/increase in x-axis
= 12/-1
=-12
Gradient when x= 3 = increase in y-axis/increase in x-axis
= 26.5/-1
=-26.5
=-27
Therefore for y= -x^3+1: -
Gradient when x= 1= -2.5
Gradient when x= 2= -12
Gradient when x= 3= -26.5
Small increment method
At x= 2
4.y= 0.5x^3 graph
Gradient when x= 1 = increase in y-axis/increase in x-axis
= 1.5/1.1
= 1.36
= 1.5
Gradient when x= 2 = increase in y-axis/increase in x-axis
= 6/1
= 6
Gradient when x= 3 = increase in y-axis/increase in x-axis
= 13.5/1
= 13.5
Therefore for y= 0.5x^3: -
Gradient when x= 1= 1.36
Gradient when x= 2= 6
Gradient when x= 3= 13.5
Small increment method
At x= 2
5.y= -0.5x^3 graph
Gradient when x= 1 = increase in y-axis/increase in x-axis
= 1.5/-1.1
= -1.36
= -1.5
Gradient when x= 2 = increase in y-axis/increase in x-axis
= 6/-1
= -6
Gradient when x= 3 = increase in y-axis/increase in x-axis
= 13.5/-1
= -13.5
Therefore for y= 0.5x^3: -
Gradient when x= 1= -1.36
Gradient when x= 2= -6
Gradient when x= 3= -13.5
Small increment method
At x= 2
6.y= 2x^3 graph
Gradient when x= 1 = increase in y-axis/increase in x-axis
= 6/1
= 6
Gradient when x= 2 = increase in y-axis/increase in x-axis
= 23.6/1
= 23.6
= 24
Gradient when x= 3 = increase in y-axis/increase in x-axis
= 54/1
= 54
Therefore for y= 0.5x^3: -
Gradient when x= 1= 6
Gradient when x= 2= 23.6
Gradient when x= 3= 13.5
Small increment method
At x= 2
7.y= -2x^3 graph
Gradient when x= 1 = increase in y-axis/increase in x-axis
= 6/-1
= -6
Gradient when x= 2 = increase in y-axis/increase in x-axis
= 23.6/-1
= -23.6
= -24
Gradient when x= 3 = increase in y-axis/increase in x-axis
= 54/-1
= -54
Therefore for y= 0.5x^3: -
Gradient when x= 1= -6
Gradient when x= 2= -23.6
Gradient when x= 3= -13.5
Small increment method
At x= 2
Conclusion
From going over the calculations I conclude that the gradient of the cubic graphs depends on the point the tangent drawn at and therefore these graphs have different gradients at different points. For example in the y= x^3 function when x= 1 the gradient is 3 but when x= 2 the gradient is 12. This shows that cubic function graphs have different gradients at different points.
Gradient of Cubic functions depends on the point the tangent is drawn at.
Combined graphs
These are graphs with combined functions e.g. y=x^2+x^3 and y=x^3-2x.
Gradient calculations
1.y= x^2+x^3 graph
Gradient when x= 1 = increase in y-axis/increase in x-axis
= 5/1
=5
Gradient when x= 2 = increase in y-axis/increase in x-axis
= 16/1
=16
Gradient when x= 3 = increase in y-axis/increase in x-axis
= 34/1
=34
Therefore for y= x^2+x^3: -
Gradient when x= 1= 5
Gradient when x= 2= 16
Gradient when x= 3= 34
Small increment method
At x= 2
2.y= 3x^2-2x^3 graph
Gradient when x= 1 = increase in y-axis/increase in x-axis
= 0/0
=0
Gradient when x= 2 = increase in y-axis/increase in x-axis
= 12/-1
=-12
Gradient when x= 3 = increase in y-axis/increase in x-axis
= 35/-1
=-35
Therefore for y= 3x^2-2x^3: -
Gradient when x= 1= 0
Gradient when x= 2= -12
Gradient when x= 3= -35
Small increment method
At x= 2
y=x^4 graphs
These are graphs with the equation y= ax^4 and y= ax^4+bx+c.
Gradient calculations
1.y= x^4 graph
Gradient when x= 1 = increase in y-axis/increase in x-axis
= 4.2/1
=4.2
=4
Gradient when x= 2 = increase in y-axis/increase in x-axis
= 32/1
=32
Gradient when x= 3 = increase in y-axis/increase in x-axis
= 104/1
=104
Therefore for y= x^4: -
Gradient when x= 1= 12
Gradient when x= 2= 32
Gradient when x= 3= 104
Small increment method
At x= 2
1.y= x^4 graph
Gradient when x= 1 = increase in y-axis/increase in x-axis
= 7.5/1
=7.5
=8
Gradient when x= 2 = increase in y-axis/increase in x-axis
= 65/1
=65
Gradient when x= 3 = increase in y-axis/increase in x-axis
= 216/1
=216
Therefore for y=2 x^4: -
Gradient when x= 1= 7.5
Gradient when x= 2= 65
Gradient when x= 3= 216
Small increment method
At x= 2
Generalization
As we can have seen earlier, the gradient straight line graph is equal to the coefficient of x. For example the gradient of y=x is 1 as the coefficient of x is 1. The gradient of Quadratic graphs depends on the point the gradient from. For example in y=x^2 graph the gradient when x=1 is 2 but when x=2 it’s 4. The cubic and y=x^4 graphs also the point that the gradient from. For example in the y=x^3 when x=1 the gradient is 3,but when x=2 the gradient is 12. From this I have come to conclusion that: -
Y=ax^2
When a=1 and n=2
y=nx^n-1
When n=3
y=4x^3-1
y=4x^3
When n=5
y=5x^5-1
y=5x^4
y=nx^n-1
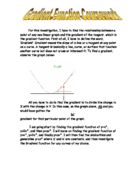
Sin, Cos And Tan graphs
They are trigonometric functions with a unique formulas such as y= cosx and
y=sinx.
The gradient of all trigonometry graphs can be calculated using the formula Gradient= d(trignomtricfunction)/dx .For example: -
As we can see in the combined graph of y=sinx + y= cosx as well as the table above, when x=0 in the y=sinx graph y=0 too but when x=0 in the y=cos x the y=1.But when x=90 in y=sin x graph y=1 and when x=90 in the y=cos x graph y=0 this shows that the Gradient of y=sin x= Gradient of y=cos x.
Bibilography
- Core Maths text book for a-levels.
- Heinemin Exdecel Maths book