When I used the random number devise. Which was ‘ran#’ button on my calculator. They results where as follows-
To find out if there is a link between league position and goals I will use a line graph. My Prediction is that they will be a strong coloration between the two. I base this upon the fact to get higher in the league you need to get points which means winning games and to win games you need to score goals.
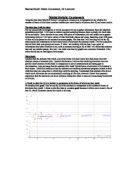
Graph 1 shows a strong inverse correlation between goals and league position. So the lower (1st being the lowest and 20th being the highest) the league position the higher the amount of goals scored.
I will now look to see weather the amount of goals scored against makes a difference. I will use the same teams as before.
Graph 2
Graph 2 shows that there is a correlation between league position and goals conceded. There is 1 anomaly with this. That is that Man City has conceded more goals than Aston Villa but are in a lower league position. My theory is that Man City have a higher goals conceded mean per defeat. For Man City it is 2.29 (2 d.p.). Where as Aston Villa’s is 1.82 (2 d.p.).
Graph 3
For every goal scored against Aston villa in a defeat Man City would concede 1.26 goals. This shows why there was an anomaly on graph 2.
I will now construct a box and whisker graph to have a look at the amount of goals scored by each time in relation to each other.
Graph 4
This graph shows that there is a big spread of teams goals with Man Utd (lowest positioned team) very much past the medium but West Ham (the highest positioned team in my investigation) are very close to the medium. This suggests that the difference between amount of goals scored at the bottom end of the table is closer that at the top end.
I am now going to look in to the relationship between goals scored and goals conceded.
Graph 5
This graph shows that point at which a positive goal difference changes to being a negative goal difference. Using the graph I have determined the cross over point to be 8th position. That means only 40% of team’s finish with a positive goal difference.
Conclusion
My conclusion is that there is a strong correlation between goals scored and league position. I have came to this conclusion thought analysing all the data. Also I have found that the top teams share most of the goals and the league is unevenly balanced. I have come to this conclusion because of the position of the cross over point not being half way.