After these calculations, a small preliminary experiment was carried out to obtain a few pieces of data that would give a rough idea of the Young’s Modulus that is to be obtained. The graph below was created using the few pieces of data obtained:
Therefore,
E = 6 x 0.1 x 9.81 x 0.0673
0.00068 x 0.01195
= 1.05 x 10¹¹ Pa
= 105 GPa
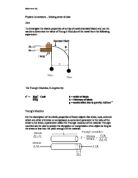
This gives an indication of the Young’s Modulus so the appropriate calculations have been done and the experiment can now be carried out. For the experiment the following apparatus will be required:
- A work bench
- 2 Wooden Blocks
- G-clamp
- Hacksaw blade
- Thread
- Small mass
- Mass (M)
- A micrometer
- A ruler
- A card with graph paper attached to it
- A pen
- A protractor
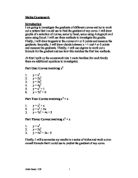
The method in this experiment was very simple:
- Measure the value for the width and thickness of the blade using the micrometer
- Set up the apparatus as shown in the diagram
- Change the distance of ‘a’
- Plot a point along the string on the graph paper
-
Measure θ from the graph paper
The results were as shown below:
b (width of blade) = 0.01195 m
d (thickness of blade) = 0.00068 m
From this we needed to calculate the appropriate values which would be used in the graph. These are shown in the table below:
From these calculations, the graph shown is over-leaf
As you can see from the graph three different lines have been drawn to represent the data: a line with maximum gradient, a best fit line and a line with minimum gradient.
The first line is the line with the maximum gradient according to the results. The following calculations were done in finding the maximum Young’s Modulus:
m = Δy
Δx
= 0.0361
0.5
= 0.0722
E = 6Mgm
bd3
E = 6 x 0.1 x 9.81 x 0.0722
0.01195 x 0.000683
= 1.131 x 10¹¹ Pa
= 113.1 GPa
The second line is the line with the average gradient according to the results. The following calculations were done in finding the average Young’s Modulus:
m = 0.0450
0.7
= 0.064285714
E = 6 x 0.1 x 9.81 x 0.064285714
0.01195 x 0.000683
= 1.007 x 10¹¹ Pa
= 100.7 GPa
The third line is the line with the minimum gradient according to the results. The following calculations were done in finding the minimum Young’s Modulus:
m = 0.007569
0.16
= 0.04730625
E = 6 x 0.1 x 9.81 x 0.04730625
0.01195 x 0.000683
= 0.741 x 10¹¹ Pa
= 74.1 GPa
Final Results for Young’s Modulus
Analysing the graph, you can see that the best fit line is considerably closer to the line with maximum gradient than to the line with minimum gradient. This is due to the fact that the distance a measured is squared in the graph so the difference between the minimum and average greater. The maximum gradient of 0.0722 was closer to the average of 0.064285714 than the minimum gradient of 0.04730625. The maximum percentage error in the gradients is calculated as follows:
Percentage error = Average value – Minimum value x 100
Average value
Percentage error = 0.064285714 – 0.04730625 x 100
0.064285714
Percentage error = 26.4125 %
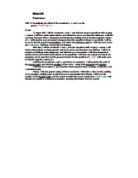
This is a fairly large percentage error that could have many causes:
-
Human error – human error is likely to be the main cause of error. It is difficult for human to read to certain accuracy. The main value which would be affected by human error would be the value for the thickness of the blade. This is because this value is cubed so the initial error would also be cubed. The value which is taken we less accuracy would have to be the angle θ. This is because as it was recorded initially on a piece of paper that was supported only by the hands of a human, there is great chance that the paper may move quite easily and thus magnifying the human error in the measurement of the angle. There is also some human error in measuring the distance a but not much as the distances were recorded to the nearest millimetre.
-
Temperature – there was some increase in temperature in the room due to the movement by pupils. This may have changes the molecular structure of the hacksaw blade expanding it and thus made the blade bend more when in fact the blade shouldn’t have. This means that any value of angle θ taken would be incorrect as the temperature would have had considerable effect.
The results for the Young’s Modulus:
From these results we can calculate the percentage error on the final values.
Percentage error = Average value – Minimum value x 100
Average value
Percentage error = 100.7 – 74.1 x 100
100.7
Percentage error = 26.4151 %
This value is very similar compared with the errors in the gradient. This shows that the graph removed the errors which would be carried forward and multiplied. These percentage errors are due to human error in taking the measurements and plotting the graph.
In conclusion, the best fit line in the graph was a straight line through the origin which proves the initial conclusion that the graph will pass through the origin. The average value for the Young’s Modulus of the hacksaw blade was calculated to be 100.7 GPa which had an error of 26.4151 %. This error was accounted for by the reasons mentioned previously.