Data Handling
Introduction:
For my investigation I am using data from a simulated school called Mayfield High School. This is a mixed secondary school with 265 students. There are 2-year groups, 10 and 11. This contains many different records, including, first name, surname, height, weight, age, month of birth, gender, IQ, distance between home and school, and Ks2 result. I have chosen to investigate the relationship between height and weight, because it is quite probable that they influence each other. Here are my hypotheses, which are all related to height, weight or both.
- There will be a positive correlation between height and weight of both years.
- To investigate if students of year 10 are heavier then year 11.
- To find out if students in year 11 are taller.
.
I will collect data on the height and weight of 50 students from both years. I will do a random stratified sample. After every four students I will pick one. I will investigate these hypotheses by drawing scatter graphs cumulative frequency graphs.
I will investigate this statement, by collecting data on the height and weight of 50 students from year 10 (same for year 11), and then by plotting a scatter graph, with height on the x-axis and weight on the y-axis. I will plot all of my data points on a graph, then draw a line of best fit.
Hypothesis 1:
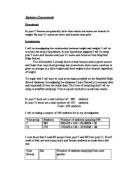
I think in this graph the points will slope upwards because I think an increasing in height will increase the weight. This mean there will be strong positive correlation.
Height and weight of students in year 10
Analysis for this graph:
As I can see from the graph above it is not strong positive correlation, which means my hypothesis wasn’t correct. There is an evidence for some positive correlation, because the points again slope upwards and there is a greater amongst them.