Investigate which newspaper out of the Sun, Daily Express, and Times offers the easiest read.
GCSE STATISTICS COURSEWORK
NEWSPAPER ANALYSIS
BY BEN INGRAM
Aim
I plan to investigate which newspaper out of the;
Sun
Daily Express
Times
offer the easiest read. I will measure readability by looking at the length of word whilst working on the basis that the longer the word, the harder it is to read. I will also compare the content and cost of each newspaper to see which appeals to the largest audience.
Preliminary Tests:
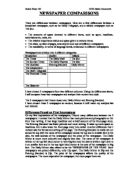
In order to determine whether or not further tests would be worth while I shall conduct a simple comparison of the front of the three papers.
By taking the first 5 words from each story and plotting the mean on a simple bar graph, I should be able to see a significant difference in word length.
Paper
Word
Length
The Times
The
archbishops
of
Canterbury
and
3
1
2
0
3
The Daily Express
Millions
of
home
owners
were
8
2
4
6
4
The Sun
They
got
the
hump
after
4
3
3
4
5
By working out the mean world length for each, we can determine which the harder read is.
Paper
Mean Word Length
The Times
5.8
The Daily Express
4.8
The Sun
3.8
It is immediately evident that the mean word length steadily reduces as you travel from top to bottom end newspapers. This means that further investigations are most definitely worth while, not only in this field, but also within each paper over the different sections.
After conducting my preliminary investigations, I have deemed it worth while to further investigate the statistics of each newspaper and make comparisons as to which one offers the harder read.
However, in order to be provided with the most accurate results, I must utilise a suitable sampling technique that ensures a selection of random words. In order to do this I will use the random number generator on my calculator to produce the numbers that can the correspond to the word. This can be done as follows:
* Put the calculator into Fix0 mode by pressing MODE three times, selecting FIX and selecting 0. This will ensure all numbers are to 0d.p.
* Generate the random number by pressing RAN# and then multiply it by the number of words in the article. This ensures it is not too high so that it does not correspond to a word in the article.
I have decided on this sampling technique as it is the most easily applied and modified to suit each different article.
Hypothesis
After conducting my preliminary investigations I believe that:
* The Times will have a significantly higher mean word length than The Sun.
* The Daily Express will have a mean word length lying in the middle of both the other papers.
* The more serious parts of the paper such as the politics section will be a harder read than the sports or celebrity news sections.
* The Sun will have more space dedicated to advertising than The Times.
* Consequently I also believe that The Sun will be a cheaper paper as it has a higher income through advertising.
* The Sun will not only have more pictures than The Times, but it will also have a higher number of colour pictures.
* I also think that the article count for The Sun will contain more general & sport than the more serious sections such as business and finance.
Investigations
Because of these predictions I shall conduct the following investigations:
. The mean word length of a story running through all three of the newspapers.
2. The mean word length of separate stories running through each different section of The Daily Express.
3. Which of the papers being analysed is the cheapest to purchase, and produce.
4. The mean amount of space allocated for advertising in each paper.
5. The mean amount of photos, both colour and black & white, in each paper.
6. The mean amount of articles featured in each paper.
Methods
I will conduct the investigations with the following methods:
. Using my calculator, I will select a random sample of 50 words from the same story in each newspaper. This is to ensure that each of the newspapers has had the same amount of information to work with. I will then analyse each of the papers by calculating the mean length and using a variety of graphs and tables to represent the data.
2. I will select a story from each of the Sports, Politics and General news sections in The Daily Express. I shall then, as stated above, compare each of the stories mean word lengths and see if they differ throughout the paper.
3. I shall simply display the different prices graphically, state how they differ, and calculate the price per printed page.
4. I shall work out the mean area (cm²) of advertising in each paper. I can then, as above, analyse them and see if the range is vastly different.
5. I shall count the number of photos in each paper and work out the mean. I shall then further this investigation and split it into coloured and black & white pictures to see if this affects the results.
6. I will count the number of articles in each paper and compare the mean against the amount of pages in each one.
Investigation 1
In this investigation I shall be trying to determine whether or not a top end newspaper, this being The Times, is a harder read than a bottom end, this being The Sun. I shall also include a middle newspaper, this being The Daily Express.
I have gone through each of the three papers for Wednesday 30th June 2004.
Each of these contained the same story in reference to Mr. S. Marks,
founder of FCUK, having to sell £40millions worth of shares in order
to pay of divorce debts.
Without including any headlines, numbers or slang words I have
counted the words in each story.
* The Sun - 277 words
* The Daily Express - 710 words
* The Times - 677 words
As they each contain different amounts of ...
This is a preview of the whole essay
I have gone through each of the three papers for Wednesday 30th June 2004.
Each of these contained the same story in reference to Mr. S. Marks,
founder of FCUK, having to sell £40millions worth of shares in order
to pay of divorce debts.
Without including any headlines, numbers or slang words I have
counted the words in each story.
* The Sun - 277 words
* The Daily Express - 710 words
* The Times - 677 words
As they each contain different amounts of words I
needed to use the following formulae to create random
numbers that would enclose every word. I have chosen
not to make the amount of words proportionate as there
is such a large difference between the papers.
* The Sun - Ran# x 277
* The Daily Express - Ran# x 710
* The Times - Ran# x 677
After creating these random numbers I counted the length of each of the corresponding 50 words and put them into the following tables.
The Sun:
Word Length
Tally
Total
2
I
3
IIIII
5
4
IIIII
5
5
IIIIIIIIIIII
2
6
IIIIIII
7
7
IIIIIIIIIIII
2
8
II
2
9
III
3
0
I
1
II
2
The Daily Express:
Word Length
Tally
Total
2
3
I
4
IIIIIIII
8
5
IIIII
5
6
IIIII
5
7
IIIIIIII
8
8
IIIII
5
9
IIIIII
6
0
IIII
4
1
IIII
4
2
II
2
3
II
2
Word Length
Tally
Total
2
3
4
IIIIIII
7
5
I
6
IIIII
5
7
IIIIIIII
8
8
IIIIIIIIIIII
2
9
IIIII
5
0
IIII
4
1
IIII
4
2
II
2
3
I
4
5
I
The Times:
It is evident from the shape of the tallies that the concentration of mean word length ranges from 5 - 7 in The Sun to 7 - 8 in The Times.
To gain a further understanding, my results can be converted into graphical format in order to show the relationships.
In order to further my investigation I am going to use standard deviation to find the range of results in each paper. This will provide further evidence as to which paper offers the most 'readability'.
In order to perform the standard deviation, I shall 'plug' my results into the following equation:
V ?(x-mu)²
(n-1)
Where x is the word length,
mu is the mean word length, and
n is the number of words.
In order to work out the mean I multiply each word length by its frequency, totalled these new numbers and divided their total by 50. The mean values are as follows:
The Sun - 5.96
The Daily Express - 7.48
The Times - 7.92
Word Length
The Times
Word Length
x Freq.
0
0
2
0
0
3
0
0
4
7
28
5
5
6
5
30
7
8
56
8
2
96
9
5
45
0
4
40
1
4
44
2
2
24
3
3
4
0
0
5
5
Total
396
Average Word Length (mean)
7.92
Standard Deviation
26.9
Word Length
The Daily
Word Length
Express
x Freq.
0
0
2
0
0
3
3
4
8
32
5
5
25
6
5
30
7
8
56
8
5
40
9
6
54
0
4
40
1
4
44
2
2
24
3
2
26
4
0
0
5
0
0
Total
374
Average Word Length (mean)
7.48
Standard Deviation
20.1
Word Length
The Sun
Word Length
x Freq.
0
0
2
2
3
5
5
4
5
20
5
2
60
6
7
42
7
2
84
8
2
6
9
3
27
0
0
1
2
22
2
0
0
3
0
0
4
0
0
5
0
0
Total
298
Average Word Length (mean)
5.96
Standard Deviation
24.9
Conclusion 1
After analysing my results through the utilisation of both graphical methods and standard deviation, I can come to the following conclusions:
* The Sun is the easiest read with its mean word length being 5.96. This is drastically lower than that of The Times which lies at 7.92.
* The Daily Express is far closer to that of a top - end paper with its mean word length being 7.48. This is only .44 away from The Times but a far larger 1.52 away from The Sun.
* Even though The Times has the largest mean word length, it also has the largest standard deviation. This means that although it is designed to be a far more mature read, it has much more variation and therefore appeals to the wider audience.
* Even though The Sun professes to be a bottom - end, every day newspaper it has a reasonably high standard deviation, meaning that it does contain some more complex words.
After coming to these conclusions I feel that I can say that my predictions were correct, and that The Times proved to be the harder paper to read, and The Sun, the easiest. Even though it proved to be a higher end newspaper, The Daily Express still lies in the middle of the three and therefore also agrees with my hypothesis.
Evaluation 1
After completing my 1st investigation I found that I have obtained a good set of results. However, upon analysing my graphs I have noticed that they each peak at 7. This could be because the first name of the FCUK founder is Stephen, this being a 7 letter name I have also used other names such as Connection. In any future investigations it may be worth not including names as they are generally repeated throughout the article and can be very long, therefore drastically affecting my results. This may be why my results for the Sun seem quite high. I will take this into consideration in my further investigations. I also need to take into account that I have only bought one day's worth of newspapers. This could have affected my results as there were no big news stories. If I had bought the papers on the last day of Wimbledon or the day after 9/11 my results may have been different as the writers had much more to write about and far more specialist terms.
Investigation 2
In this investigation I shall, like in investigation 1, analyse the different sections of a mid - range newspaper. I have selected three stories from The Daily Express:
* A Royal Correspondence - A story about the new Princess Diana Memorial.
* A Celebrity Story - A story about Christina Aguilera in a Milan fashion show.
* A Sports Story - A story about Tim Henman's supporters on the Hill.
After evaluating my first investigation I have decided not only to not include numbers and slang words, but also names. This should prove for a far more reliable set of results. I shall use the same sampling technique as before and have already sampled my words and conducted the word count. The results are as follows:
* Royal Correspondence - 763
* Celebrity Story - 257
* Sports Story - 614
Therefore the random number sums will be as follows:
* Royal Correspondence - Ran# x 763
* Celebrity Story - Ran# x 257
* Sports Story - Ran# x 614
After selecting my words I counted each of them and inputted them into my results tables:
Royal Correspondence:
Word Length
Tally
Total
2
3
III
3
4
IIIIIIIIIIII
2
5
IIIIIIIIII
0
6
IIIIII
6
7
IIIIIIII
8
8
IIII
4
9
III
3
0
II
2
1
II
2
2
I
Celebrity Story:
Word Length
Tally
Total
2
I
3
II
2
4
IIIIIIIII
9
5
IIIIIIIIIIII
2
6
IIIIIIIIII
0
7
IIIIII
6
8
IIII
4
9
IIIII
5
0
1
2
3
I
Sports Story:
Word Length
Tally
Total
2
3
I
4
IIIIII
6
5
IIIIIIIIIIIIII
4
6
IIIIIII
7
7
IIIIIIII
8
8
II
2
9
IIIIIII
7
0
II
2
1
II
2
2
I
It is evident from my tallies alone that each story has a large amount of words containing 5 letters. This could be because a vast majority of connectives contain 5 letters, such as; these, their, where and so on.
To better understand my results I will plot them in graphical format.
To further understand these results I shall use box and whisker plots to compare each of the sections. This should help in identifying whether or not the readability depends on the section of the paper the story is in.
Royal Correspondence:
Celebrity Story:
Sport Story:
Conclusion 2
After analysing my results I can say that my hypothesis was wrong. Unlike what I believed prior to my investigation, the sport story is the harder read with the royal correspondence being nearly on par with the celebrity story. I believe this is because the sport and celebrity story had far more specialised terms.
I can conclude that the readability of an article does not depend on the section of the paper it is in, but more so on the subject matter, as this is what affects the terminology and therefore word length. As shown in the stem and whisker plots, even though the celebrity story has the highest extreme, it has the lowest median which means that the majority of its words are lower than say that of the royal correspondence which has a slightly higher median and a much higher upper quartile.
Evaluation 2
Even though my results did not agree with my hypothesis they seem to be correct and have provided me with a reasonable conclusion. I can therefore state that not including names has most definitely increased the reliability of my results. However, it may be beneficial in further investigations not to include connectives as these are all 4 - 5 letters long and it is most evident in my result tallies that this has affected my final results.
I have decided to do a further investigation to see what percentage of these articles are in fact connective words.
I counted the amount of connectives such as; and, there, too, a, the, she and so on. I then worked out what percentage of each article was made up of these words.
Royal Correspondence: 763 words - 264 connectives = 499 proper words
Celebrity Story: 257 words - 90 connectives = 167 proper words
Sports Story: 614 words - 247 connectives = 367 proper words
These figures helped me work out what percentage of each article was made up of connectives:
Royal Correspondence: 35% connectives
Celebrity Story: 35% connectives
Sports Story: 40% connectives
These results totally contradict my investigations results and say that the sport story is the easiest read as it has the most connectives. However, it could be that my sampling
missed out a lot of these. Therefore my results are still correct but it may be beneficial in future investigations not to include them.
Investigation 3
In this investigation I am simply going to investigate which of the papers is the cheapest. I can then link this in later as the results could affect the amount of pages in the paper and therefore the amount of advertising and articles.
This investigation does not require a sampling technique; I simply need to compare the prices which are as follows:
* The Sun - 30p
* The Daily Express - 40p
* The Times - 50p
These results can also be compared graphically to provide a better understanding.
From these comparisons I can easily state that The Sun is the cheapest paper and The Times is the most expensive.
To calculate the cost per published page of each newspaper, I simply divided the price by the number of pages:
The Times - Cost 50p Pages 80 - Cost per page: 0.00625p
The Express - Cost 40p Pages 80 - Cost per page: 0.00562p
The Sun - Cost 30p Pages 56 - Cost per page: 0.00536p
This proves that the Sun is not only the cheapest paper to buy, but also the cheapest to produce.
N.B: I have had to multiply the figures by 1,000 in order to make a literate graph.
Conclusion 3
This investigation has proven to concur with my hypothesis. The Sun is the cheapest and The Times the most expensive. This may help in later investigations when I compare which newspaper has the most articles, pictures and advertising. If my prediction is right then the Sun will have the highest income from advertising, and is the cheapest to produce.
Evaluation 3
The investigation was conducted well. Even though it was simple, I believe the results will be of use in later comparisons and analysis.
Investigation 4
In this investigation I will be comparing which paper allocates the most space for advertising. This may help in explaining the prices as the more advertising a paper contains, the more profit they are making.
One thing to take into consideration is that the papers are each of different length. Because of this I will not be able to directly compare the results until they have been put into mean amounts of advertising per page.
In order to collect my results I went through each paper and measured the adverts in cm². The final results were as follows.
Paper
Advertising
(cm²)
Advertising
(m²)
The Sun
The Daily Express
The Times
3694
4937
3033
37
49
30
All the above results are to 0d.p.
In order to compare the results I must divide each of the above by the number of pages in their corresponding papers. The amount of pages in each paper is as follows:
* The Sun - 56
* The Daily Express - 80
* The Times - 80
Paper
Advertising
(cm² per page)
Advertising
(m² per page)
The Sun
The Daily Express
The Times
245
87
63
2.45
.86
.63
The results for metres per page had to be shown to 2d.p otherwise they would have all equalled 2.
These two graphs show how although the Express may have the most advertising overall, The Sun has the most per page.
It is evident from these results that although it is the smallest paper, The Sun has the most advertising per page.
Conclusion 4
My results agree with my hypothesis, they prove that The Sun does have the most advertising per page. This could explain why it is the cheapest and The Times is the most expensive.
Each of the adverts in any of the newspapers must be paid for by the advertiser. This means, that the more adverts in a paper, the more revenue they make before the paper is even sold. Therefore, as it has the most advertising per page, The Sun is the cheapest paper.
Even though The Times and Daily Express have more ads overall they also have the most pages. Because of this they require far more advertising to pay for the printing of each page. With this fact taken into consideration, they do not have enough advertising in their paper for it to be as cheap as The Sun.
Evaluation 4
This investigation has proven to be very reliable. Not only has it proved my hypothesis, but it also concurs with Investigation 3 in that The Sun is the cheapest paper as it has the most advertising per page. The information I have come to conclude on may also help when I analyse the amount of pictures both coloured and black & white as coloured pictures are more expensive to print.
Investigation 5
In this part of my investigation I am going to see which paper has the most photos. This could help me in further understanding the pricing as the more photos a paper has, the more they are paying for each page of printing.
To conduct this investigation I counted the amount of pictures in each paper and then split them into coloured and black and white. I did this because a black and white printing is not going to affect the price as much as a colour picture would.
Paper
Colour Pictures
B/W Pictures
The Sun
The Daily Express
The Times
70
44
39
57
69
56
As shown in the above table, The Sun focuses more on colour picture, The Daily Express on black and white pictures and The Times seems to focus more on text than photos.
In order to further the investigation I put the data into pie chart format. This helps in showing which paper has the largest percentage of each type of photo.
Colour Photos:
B/W Photos:
As shown in the pie charts above The Sun has the largest percentage of colour photos. However, it is almost on par with The Times when it comes to black and white photos.
Conclusion 5
My results concur with my hypothesis as they both state that The Sun has the largest amount of colour photos. It also had a larger amount of black and white photos than The Times. What I didn't hypothesise was the fact that The Daily Express had such a large amount black and white photos. In fact it had a larger amount than The Sun.
My results do not however, help in understanding the pricing. I think that a possible explanation for The Sun's low price, and high colour photo content, could be that the advertising provides the extra revenue to cover the costs. The main appeal of The Sun is its colour pictures and eye catching articles, not necessarily its news content.
What the results do tell me is that The Sun is the easier read as it has more photos. A reader will be far more interested in a story with photos.
Evaluation 5
I believe this investigation was conducted well and has given me far more insights into the readability of each paper. A further investigation could be to look at the types of photos in each paper and whether or not these would attract the reader and increase readability. Indeed it could be that The Sun's page 3 was designed as an ideal way to attract readers.
Investigation 6
In this final investigation I am going to find out which types of articles feature most in each paper. This should help in finalising my conclusion as to which paper offers the most readability as theoretically the more entertainment, general news and sports pages there are, the easier it is to read.
In order to conduct the investigation I first counted how many of the articles in each paper were dedicated to in-depth articles; short stories and features; and finally sport.
The Times: Main Articles: 34 Short Features: 51 Sport: 8
The Express: Main Articles: 29 Short Features: 40 Sport: 8
The Sun: Main Articles: 18 Short Features: 50 Sport: 5
I then looked at them in pie chart format in order to highlight my findings and show in percentage form the content of each paper.
The Sun:
The Daily Express:
The Times:
These show that, unlike my hypothesis, The Daily Express seems on par with The Sun as although it may not have as many short stories, it has more sports stories.
My final comparison looks at the relationship between the amount of pages against the number of articles.
Unlike the above pie charts, this shows that The Sun is the easiest read as it has the least stories and pages.
I decided to conduct one further investigation; this was to count the actual number of pages in each paper that was dedicated to each of the following sections.
Paper
General
Adverts
Sport
Entertainment
Business
The Times
40
5
4
2
9
Express
44
8
5
9
4
The Sun
29
9
3
5
0
These figures confirmed my finding above; The Sun is the easiest read because it contains more features of general interest and none of the articles that would appeal to the more educated business sector.
Final Conclusion
From this last investigation I can finally conclude that The Sun is the most easily read paper out of the three that I sampled. Although The Daily Express has seemed to be on a par with The Sun on certain occasions; overall it is still a slightly harder read. This set of results shows that The Express does contain some slightly more serious sections such as politics and business where The Sun contains none.
I have also found that although The Sun is the easiest read, The Express covers a wider range of topics and should therefore appeal to the widest audience out of the three papers. It is very clear that the papers I chose target very different areas of the population. The Times offers larger more in-depth articles of news and finance. The Express covers a more extensive range of topics without going into as much detail. The Sun on the other hand does touch on news items, but focuses more on human interest stories.
What can be said for certain though is that, as proved in the graphs, large amount of articles, and more in-depth articles, don't always mean a harder read. It depends on the subject being covered and therefore the terminology that is used.
Final Evaluation
I believe that my investigations have been conducted fairly and have provided me with a good set of results that have allowed me to come to some reasonable conclusions. I have steadily bettered my methods as I progressed through each investigation and believe I have used the correct sampling and analytical skills to provide my evidence.
What I can say is that if I ever have to conduct investigations like this again, I would take heed of my prior evaluations and amend my methods accordingly.
GCSE STATISTICS COURSEWORK
BEN INGRAM Page 1 of 26 10R