Sampling:
Outliers:
(Extreme values) any value that is more than two standard deviations from the mean is regarded as an outlier.
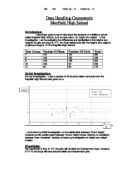
Acceptable Intervals:
I worked out the acceptable intervals so that I could identify any outliers present
Statistical Methods :
The methods that I will use to test my hypothesis are –
- Grouped Frequency Tables – To calculate averages for my data.
- Stem And Leaf Diagrams – To calculate Quartile data.
- Box And Whisker Plots - To compare the differences between the year groups and sexes.
- Scatter Graphs – To find the correlation coeff, and identify outliers.
- Calculate Averages And Quartile Data.
Analysis:
What my box and whisker plots tell me:
Through the box and whisker plot, we can see that in Yr 7, the median height for girls is exactly the same as for boys, and the interquartile range is slightly smaller than in boys indicating that the data is more consistent. However, the range between lowest and highest in girls is much greater than in boys, suggesting that there are more or more severe outliers in the girls data than in boys. However, on the whole boys and girls height in Yr7 are very similar. On the other hand, in Yr10, boys are on average much taller than girls, with their median height equal to the girls upper quartile. Also the IQR for boys is also much greater than girls indicating a wider spread of data. There is a greater population density between the median and the lower quartile, than the upper quartile in Yr10 boys. In addition, there is a bigger range between the lowest and highest in boys than in girls, suggesting a wider spread of data with more widespread outliers. All of this supports my hypothesis except that I predicted that girls would be taller than boys in Yr 7, but the data indicates that they are the same.
In Yr 7, boys are on average much heavier than girls. The median weight for boys is almost as heavy as the girls highest weight, and the IQR for boys is bigger than for girls, indicating more consistent data for girls. Also, the range between the highest and lowest in boys is much greater then in girls, suggesting more severe outliers in the boys’ data. In Yr10, the boys are still heavier than girls, but by a smaller margin, there is a much greater population density between the median and the lower quartile than the upper quartile in Yr10 boys, and in girls the opposite is true. There is a much greater population density between the median and the upper quartile. The IQs for both are pretty similar, but the range between the highest and lowest is much greater in boys than in girls, indicating the presence of severe outliers. These results support the second part of my hypothesis, but do not support the first. The girls were not heavier than boys in Yr 7.
What my averages tell me :
For Yr 7 boys, the estimated mean from my grouped frequency table is 1.566 m, which is only slightly higher than my median from the box plots which is 1.55m. The median is more reliable because it is not affected by any outliers, Like the one boy who fell into the 1.35 – 1.45 category. However, in Yr 7 girls, the estimated mean height was 1.546m which was slightly lower than 1.55, which was the median height in the box and whisker plot. As there is so little difference, between the medians and the estimated means, we can see that either there are very few and inconsequential outliers, or the outliers are cancelled out by more outliers at the other end of the scale.
What my scatter graphs tell me:
Through my scatter graphs, I was able to ascertain that there is no correlation between the heights and weights of girls in Yr 7 and in Yr 10. I also found that the values were more widely spread in boys and girls in Yr 7 than in boys and girls in Yr 10. I also was able to find an outlier in the Yr 7 girls by calculating the acceptable intervals and drawing them on the graph. My scatter graphs support my Box and Whisker plots. The correlation coefficient for Yr 7 boys is stronger than for Yr 7 girls, and although the correlation coefficients get stronger for both boys and girls in Yr 10, Yr 10 boys still have a stronger correlation.
Conclusion:
Through my investigation I have found that the results support my theory on Height, and how although girls would be taller in Yr 7, by Yr 10 boys would be taller. However, the results of the investigation do not support my theory on weight, and girls were not heavier in Yr 7.
I could have improved the validity of my investigation:
- If I had compared KS3 with KS4 instead of Yr7 and Yr10.
- If I had used a larger sample of students for example, I could have taken a 20% sample instead, so that the problem of being left with just 9 students would be solved, and to get more reliable data.
- If I had compared the heights and weights of students when they were in Yr7, and then waited 3 years and compared the same students in Yr 10; instead of comparing two separate groups of students.