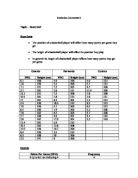
Statistics Coursework
Topic – Basketball
Hypothesis
- The position of a basketball player will affect how many points per game they get
- The height of a basketball player will effect the position they play
- In general the height of a basketball player effects how many points they get per game
Guards
Forwards
Centres
Guards Mean For PPG
Estimate of mean = sum of (middle values x frequencies) ÷ sum of frequencies =
∑fx ÷ ∑f = 156 ÷ 19 = 8.21 (2 d.p)
Forwards Mean For PPG
Estimate of mean = sum of (middle values x frequencies) ÷ sum of frequencies =
∑fx ÷ ∑f = 150 ÷ 19 = 7.89 (2 d.p)
Centres Mean For PPG
Estimate of mean = sum of (middle values x frequencies) ÷ sum of frequencies =

∑fx ÷ ∑f = 66 ÷ 19 = 3.47 (2 d.p)
Guards Modal Class Interval for PPG
Modal class intervals equals ‘4 up to but not including 8’ because it has the highest frequency
Forwards Modal Class Interval for PPG
Modal class intervals equals ‘4 up to but not including 8’ because it has the highest frequency
Centres Modal Class Interval for PPG
Modal class intervals equals ‘4 up to but not including 8’ because it has the highest frequency
Guards Median for PPG
...This is a preview of the whole essay
∑fx ÷ ∑f = 66 ÷ 19 = 3.47 (2 d.p)
Guards Modal Class Interval for PPG
Modal class intervals equals ‘4 up to but not including 8’ because it has the highest frequency
Forwards Modal Class Interval for PPG
Modal class intervals equals ‘4 up to but not including 8’ because it has the highest frequency
Centres Modal Class Interval for PPG
Modal class intervals equals ‘4 up to but not including 8’ because it has the highest frequency
Guards Median for PPG
Median equals n + 1 ÷ 2 = 19 + 1 ÷ 2 = 10th value. Which is in the class interval ‘4 up to but bot including 8.
Forwards Median for PPG
Median equals n + 1 ÷ 2 = 19 + 1 ÷ 2 = 10th value. Which is in the class interval ‘4 up to but bot including 8.
Centres Median for PPG
Median equals n + 1 ÷ 2 = 13 + 1 ÷ 2 = 7th value. Which is in the class interval ‘4 up to but bot including 8.
Guards Standard Deviation for PPG
Mean = 156 ÷ 19 = 8.21 (2 d.p), Standard Deviation = √∑fx² ÷ ∑f - mean² = √1644 ÷ 19 – 8.21² = √86.53 – 67.4041 = √19.1259 = 4.37 (2 d.p)
Forwards Standard Deviation for PPG
Mean = 150 ÷ 19 = 7.90 (2 d.p), Standard Deviation = √∑fx² ÷ ∑f - mean² = √1836 ÷ 19 – 7.90² = √96.63 – 62.41 = √34.22 = 5.85 (2 d.p)
Centres Standard Deviation for PPG
Mean = 66 ÷ 13 = 5.08 (2 d.p), Standard Deviation = √∑fx² ÷ ∑f - mean² = √436 ÷ 13 – 5.08² = √33.54 – 25.8064 = √7.7336 = 2.78 (2 d.p)
PPG Averages
Guards have the highest mean for PPG followed by forwards and centres last. This suggests that the position of a player effects how many points per game they get and that centres are least likely to get more points per game than forwards or guards. The modal class interval and median were equal and the same for each position. Suggesting that the most often average points per game for each position is equal to its middle value. Forwards had the highest standard deviation. Meaning that forwards data is more spread out across the mean than any other position. Evidence from my data suggests that 42% of forwards and guards have a PPG of between 4 and 8 and 46% of centres PPG is between 4 and 8 this shows that the position of a player effects their PPG
Guards Mean for Height
Estimate of mean = sum of (middle values x frequencies) ÷ sum of frequencies =
∑fx ÷ ∑f = 3715 ÷ 19 = 195.53 (2 d.p)
Forwards Mean for Height
Estimate of mean = sum of (middle values x frequencies) ÷ sum of frequencies =
∑fx ÷ ∑f = 3935 ÷ 19 = 207.11 (2 d.p)
Centres Mean for Height
Estimate of mean = sum of (middle values x frequencies) ÷ sum of frequencies =
∑fx ÷ ∑f = 2745 ÷ 13 = 211.15 (2 d.p)
Guards Modal Class Interval for Height
The modal class interval is ‘190 up to but not including 200’ because it has the biggest frequency.
Forwards Modal Class Interval for Height
The modal class interval is ‘200 up to but not including 210’ because it has the highest frequency
Centres Modal Class Interval for Height
The modal class interval is ‘210 up to but not including 220’ because it has the highest frequency
Guards Median for Height
Median equals n + 1 ÷ 2 = 19 + 1 ÷ 2 = 10th value. Which is in the class interval ‘190 up to but bot including 200’
Forwards Median for Height
Median equals n + 1 ÷ 2 = 19 + 1 ÷ 2 = 10th value. Which is in the class interval ‘200 up to but bot including 210’.
Centres Median for Height
Median equals n + 1 ÷ 2 = 13 + 1 ÷ 2 = 7th value. Which is in the class interval ‘210 up to but bot including 220’.
Guards Standard Deviation for Height
Mean = 3715 ÷ 19 = 195.53 (2 d.p), Standard Deviation = √∑fx² ÷ ∑f - mean² = √727475 ÷ 19 – 195.53² = √38288.15789 – 38231.9809 = √56.17699 = 7.50 (2 d.p)
Forwards Standard Deviation for Height
Mean = 3935 ÷ 19 = 207.11 (2 d.p), Standard Deviation = √∑fx² ÷ ∑f - mean² = √815475 ÷ 19 – 207.11² = √42919.73684 – 42894.5521 = √25.18474 = 5.02 (2 d.p)
Centres Standard Deviation for Height
Mean = 2745 ÷ 13 = 211.15 (2 d.p), Standard Deviation = √∑fx² ÷ ∑f - mean² = √579925 ÷ 13 – 211.15² = √44609.61538 – 44584.3225 = √25.29288 = 5.03 (2 d.p)
Height Averages
Centres have the highest mean followed by forwards and guards last. Which is the reverse order of the mean for PPG, which I investigated earlier. This suggests that the height and PPG of each position correlates. The modal class interval and median were equal and the same for each position. Suggesting that the most often height for each position is equal to its middle value. The modal class interval and median increases for each position. It shows that tallest players are centres, the shortest players are guards and the average height players are forwards. Guards had the highest standard deviation. Meaning that the guards data is more spread out across the mean than any other position. There was only a 0.1 difference between forwards and centres standard deviation. This shows that both there data is similarly spread across the mean.
Evidence from my data suggests 42% of guards height were between 190 and 200 cm. 68% of forwards height were between 200 and 210 cm. 62% of centres height were between 210 and 220 cm. These conclusions are based on a sample of only 50 players. I could extend the sample or repeat the whole exercise to confirm my results.