For example you could take 118 students by using the random function on your calculator.
After my samples are selected, in any of the ways above, I will have to present the data and prove what I think is correct. This will be done by:
- Aim and hypothesis – when these are made, it will provide me with something to prove.
- Creating a table – this table will consist of my sample. It will only contain the data on height and weight. I could also use other tables such as cumulative frequency to help me present my data.
- Correlation – after I have completed my table, I will construct a graph. From the graph I must decide where the points are shaping. Is there negative or positive correlation, or is there none at all.
- Mean, mode and median - this will help me to interpret the average weight or height. It will give more evidence to support the statements made. The mode is the most frequent number, and the median is the middle number when arranged in order. The median is worked out by adding one to the total and diving by two. The mean is the average, this will be worked out by adding all the numbers together, and then dividing by the amount of numbers there are.
Sum of values
Mean =
Number of values
- Box plots – using the graph I could work out the lower and upper quartiles. Then from the results of the mean, mode and median, I could draw a box plot. This could be used to compare and evaluate data.
Lower quartile Upper quartile
Minimum maximum
Median
- Line of best fit – this will be drawn on the graph to work out predictions. I will give my line of best fit an equation. Using the equation I could work out how heavy a person would be if he were 150 cm tall. The equation is
y = mx + c. To find the gradient this could also be shown as:
y
y1
m =
x1
y1
x1
c
- Minimizing bias – throughout the coursework, problems will arise regarding being bias. This means in some cases I may favour someone else or be unfair. This is not good because it affects my results. For example I may choose more girls than boys or more year 11 than year 7. This can be avoided by using different kinds of sampling, which suits the situation. This way my results will remain fair.
- Mean of deviations from the mean – this is another measure of spread. This again provides evidence for comparison. From this you can work out the how far away a height is from the average.
Height – mean height = deviation
Although if you wish to work out the mean of the deviations, you must work all the deviations out then use this equation:
∑|x – x|
= Mean of deviations
n
When working this out you ignore the negative values a deviation may have. After the calculations are made you can compare various types of data found out.
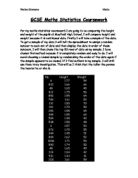
Aim – to find and comment on the proper relationship between height and weight. Also, answer questions such as, is there a line of best fit? What is the correlation of the graph? Is there a clear relationship and how is it proved?
Hypothesis – for this enquiry I predict that the taller the height, the heavier the weight. I will test this throughout enquiry one. I believe this hypothesis because according to science if you are taller, so to will your bones. Therefore if your bones are bigger, then in the rules of science they must be heavier. I have decided to take a sample size of 10%, using selective sampling. Meaning, I will pick every 10th student. This will result in giving me 118 students.
From the line of best fit you can see there is a positive correlation. I will now work out the mode.
From my results the mode numbers for height are 1.72m, 1.65m, 1.62m and 1.60m. The mode for weight is 50 kg.
From my results the median height is:
192.52 + 1
= 96.76th position
2
Which is 1.70m
From my results the median weight is:
6008 + 1
= 3004.5th position
2
Which is 85kg
From my results the height average is:
192.52
Mean =
118
= 1.632m
The average weight is:
6008
Mean =
118
= 50.92kg
Therefore we learn the average person is 50.92kg in weight, and 1.632m in height.
I will also work out the mean of the deviations,
The mean deviation for height is:
1501.6
Mean deviation =
118
= 12.73cm
The mean deviation for weight is:
1088.720
Mean deviation =
118
= 9.226kg
Using the equation on my graph, I can work what height or weight a person will be based on the line of best fit.
If a person weighs 50kg,
y= 0.0073 x 50 + 1.2482 =1.6078m is their height (from the line of best fit)
If a person weighs 40kg,
y= 0.0073 x 40 + 1.2482 =1.5402m is their height (from the line of best fit)
Therefore from all of these calculations I have proven my hypothesis to be correct. This is because I have shown as the weight increases so to does the height.