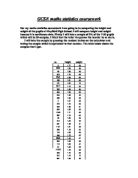
Year 10 boys
I have rounded it down to 13. I will use 13 samples of data from year 10 boys.
Year 10 girls
I have rounded the number to 12. I will use 12 samples of data from year 10 girls.
Year 11 boys
I have rounded up to 11. I will use 11 samples of data from year 11 boys.
Year 11 girls
I have rounded the number up to 11. I will use 11 samples of data from year 11 girls.
I will check if my calculations are correct by adding al my sample sizes together and see if they add up to 150 if they don’t I have made a mistake.
19+17+18+16+15+18+13+! 2+11+11=150 my calculations were correct I have figured out how much data I will take from each group.
Now I will pick the data I need from the database to make this investigation fair I have to do this in an unbiased way. To do this I will sort the data to make it the order it is in completely random. I will then pick my data from the separate groups. I will do this by adding the formula into Microsoft excel. Once I have added the formula I will sort the data into10 different groups (gender and year group e.g. year 10 boys)
I will then pick the data I need from each group I will know how much to pick because of the stratisfied sampling I did earlier for example for year 7 boys I will pick the first 10 pieces of information. I will pick the first 10 to remove bias because if I pick and choose any data I want I could be picking data that is easy to work with so by picking my data this way I am removing bias.
The following is all the data I will use for hypothesis 1.
I will now do my pre test to see if my hypothesis is good enough to investigate further. I will know if the hypothesis is good enough to warrant further investigation by working out the correlation between height and weight. And making a scatter graph and seeing if the correlation on it is positive. If the correlations are strong and positive I will have enough proof that the hypothesis is correct if this happens I will investigate the hypothesis further. The data I am using is continuous this will make the results more varied. The more varied the results are the more options I have in how I will study the data. The continuous data will give me more accurate results and will note cause problems by overlapping like discrete data does.
To do my pre-test I need to have a smaller amount of data than the 150 pieces of data I have got. To be precise I need 25 pieces of data. I will pick 25 pieces of data from the 150 I will do this by using the ran method on my calculator. The ran method is bias free way of choosing data. I am using the ran method because if I was to choose the data myself I would sub-consciously choose the numbers that are easier to work with. So by using the ran method I am making my investigation more fair. And the fairer my investigation is the more credence I can give to my results.
The 25 pieces of data I have picked using the ran method are
I have deleted year group and gender and just left height and weight because I won’t need year group and gender when I make the scatter diagram and work out the correlation.
The graph above is a scatter diagram of the 25 pieces of data i chose earlier. the linear line shows that the correlation i positive. In the graph at the far right there is a anomly an anomly is a feak result and should be discounted from your results. I know this because it is because it facing upwards witch means the corelation is positive. A positive corraltion shows that as the weight increases so does the height.
I will know using the corral method worked out the coreleation between heigh and weigh from the 25 pieces of data i chose earlier. The corral method is way of working out corraltion quickly and easly in microsoft excel. The way you do it is by highlighting the data you wish to use in excell then typing in this fromula in the formula box =Corel (A1:A21, B1:B21. This will give you a correlation. There i another way to work out the correlation and that is to us this formula
But using that formula is difficult and time consuming that is why I used the corral method to work out the correlation. Using the coral method I got a correlation of 0.572504.
0.572504 is strong coral ion and shows me that the hypothesis “the taller you are the heavier you are” has a good chance of being correct.
Conclusion
In this investigation I had to use a database containing information about 1183 pupils from a fictional school called Mayfield High. At first I had to start off by choosing two hypotheses. My first hypothesis was “the taller you are the heavier you are.” I had to get 25 sample numbers from the database in order to do a pre-test to check if the correlation between the 2 sets of data would be strong enough to use. I had to use the random bias free method in Microsoft Excel to eliminate bias when choosing these numbers. I then using the 25 pieces of data I worked out the correlation of the sets of data. I worked the correlation out in excel using the formula=corral (array1, array2). The correlation I got was 0.65214. 0.65214 is a strong positive correlation it told me that there was a positive link between height and weighty. Stratifying my data I found out how many people from each year group that I would need in my investigation. This is an accurate and unbiased way of using the data because stratifying the data means that I am not picking the numbers myself this makes the investigation fairer and gives me more accurate results. I chose 150 random numbers because I think that the more you use the more accurate your results but it would not be realistic to use 1000 pupils because this would take me far too long. By looking at my strong positive correlation and scatter graph I worked out after I did stratified sampling I can conclude that taller you are the more you weigh. This claim is made stronger if you look at how strong my correlations were
Hypothesis 2
My second hypothesis is “girls have higher IQs and grades than boys in year 7 but by year 11 boys will have caught and have roughly the same IQs and grades”. For this hypothesis I will first compare exam grades and IQ of the 2 gender groups in year 7. I will then compare 1Qs and and exam grades of the two gender groups in year 11 from the results. I will look at weather girls had higher IQ and grades at this stage of their education. I will then compare the two studies and see if my hypothesis and see if boys have become more intelligent than the girls if weather they were less intelligent in the first place. I believe that girls achieved better grades in year 7 I believe this because girls are generally more mature at a younger and therefore because of their majority they would work harder than their male counterparts who are less mature. By year 11 the boys should have matured enough to match their female counterpart’s work ethic and his would help them to get better grades catching up and in some situations passing the girls grades and IQs.
I will collect the data I need for each year group. I only need year 7 by year 11boy’s girls and year 11 boys and girls because they are the only 4 groups I will analyse and compare to each other. To do this I need to stratify sample again this time I want a sample group of 100. I will stratify sample because it eliminates bias. I have decided to use one hundred pupils in my investigation because if I did any less I would not have enough data to reach an accurate conclusion. If I used below one hundred it would not give me an actual fair account of what is happening. If I use more than 100 it will take too much time. I will use scatter diagrams, box plots, tables, cumulative frequency, box and whisker, frequency polygons to help me investigate my hypothesis. I will now do my stratifying sample it’s the same as I done it before except this time the sample is less, this means I will get less numbers than before.
Year 7 boys – 151/1183 * 100 = 13 I have left out the decimal number and rounded up or down.
Year 7 girls – 131/1183 * 100 = 11
Year 11 boys – 84/1183 * 100 = 7
Year 11 girls – 86/1183 * 100 = 7
Now that I have stratifies sampled I know how much data to get from each group. I will now using my calculator use the ran method to find out what number to get. When using the ran method the calculator gives you random number for example 5 7 8. I would go to 7th data in my database and use the data from it the I would go to the 8th etc
Year 7 boys = (51,27,49,67,32,24,30,29,59,63,45,11,31)11 sets of data
Year 7 girls = (100,68,116,53,62,51,13,22,40,109,48)12 sets of data
Year 11 boys = (24, 42, 33, 37, 16, 49, 84)7 sets of data
Year 11 girls= (11, 65, 87, 21, 55, 88, 90)7 sets of darta
The numbers in the brackets are the number I will choose from my database for example for the number 59 year 7 I will choose the 59th person on the list.
I have chosen the data from my database the following is all the data i am gonna use for my second hypothesis.
First I will check if the girls had better IQs in year 7 than the boys. I will do this by doing a grouped frequency table for both boys and girls then I will compare them.
Boys year 7
Total frequency =9 total fx =932.5
The table above is the grouped frequency table for girls. The table shows my class intervals, which are of equal widths and mid and end. This grouped frequency table for the boys shows me that my class intervals are of equal widths which means that I do not need to use frequency density. By viewing this table I can work out that the modal group here is 100 ≤ IQ< 105 because it has the most people fir into it. Most of the year 7 boys have an IQ between 110 and 105. My total frequency which is the same as cumulative frequency is 9. This is correct because I’m worked out I need 7 people in my stratifying sampling.
I will now do a grouped frequency table for boys.
Total frequency =12
The table above is the grouped frequency table for boys. The table shows my class intervals, which are of equal widths and my cumulative frequency with mid and end. By looking at this table I can see that the modal group is the 100 to 105 group because it has the highest frequency. My total frequency is 12 I know this is correct because it matches my stratified sampling of year 7 girls.
Comparing the two tables I see that both of the tables have the same model groups. Witch tells me that the average for both is around the same.
I have worked out that the boys average is 102.3333And the girls average is 100.8 this tells me that boys on average have a higher IQ in year 7.Also the boys in is 97 and the girls in 96. The boys max is 112 and the girls max is 107. This tells me that the boys have the highest iq among them and the girls have the lowest.
This disproves my hypothesis that girls have a higher IQ than boys in year 7.