Boys Height:
Cumulative Frequency graphs for the students that got selected for the investigation after my random sampling.
Boys Weight:
Cumulative Frequency graphs for the students that got selected for the investigation after my random sampling.
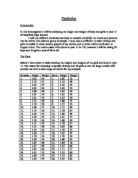
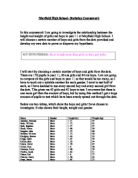
Random sampling to gain 50 students, 25 boys and 25 girls for my investigation. I will use the every third student method.
Girls Height:
Cumulative Frequency graphs for the students that got selected for the investigation after my random sampling.
Girls Weight:
Cumulative Frequency graphs for the students that got selected for the investigation after my random sampling.
Boys Height Box Plot:
Boys Weight Box Plot:
Girls Height Box Plot:
Girls Weight Box Plot:
Comparison of Box Plots:
The result shows that the girls height and weight box plots were much closer together then the boys height and weight box plots. The boys also may have had extreme values.
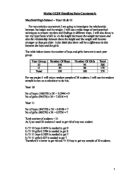
Stem and leaf diagrams to obtain the averages; mean, modal class interval, median and range for year 11 boys and girls.
Boys Height Stem & Leaf:
150+152+155+157+158+162+ 162+163+165+165+167+168+ 168+168+169+172+173+177+ 179+181+182+184+192+194+ 196
25
= 170 CM
Boys Weight Stem & Leaf:
35+45+47+50+50+50+54+54+ 54+55+56+57+58+58+58+59+ 60+ 60+63+66+72+72+78+80+ 93
25
= 59 KG
Girls Height Stem & Leaf:
133+152+152+157+158+158+ 160+160+160+161+162+162+ 163+163+163+163+165+165+ 168+168+170+172+174+175+ 178
25
= 162 CM
Girls Weight Stem & Leaf:
38+38+39+42+44+44+45+47+48+48+ 48+48+48+54+54+54+54+55+55+56+ 59+ 60+63+66+66
25
= 51 KG
Summary Of Stem & Leaf:
Conclusion For Height Boys And Girls:
The mean height of the boys is higher than the mean height for the girls.
The median for the boys is higher than the girls, also the range of the girls 0.46m and is extremely close to the boy’s range of 0.45m. The Stem & Leaf diagram shows that more girls than boys have a height less than 160cm, but more boys than girls have a height more than 170cm. These results are based on a random sample of 25 boys and 25 girls from year 11.
Conclusion For Weight Boys And Girls:
The mean height of the boys is higher than the mean height for the girls. The median for the boys is higher than the girls by 10, which means the girl’s weight have a lot more smaller value than the boy’s weights. The range for the boys is 0.58 and is extremely higher than the girl’s range which is 0.28; this is because for boys the highest weight for the boys is 93kg which is 27kg higher than the girl’s highest weight which is 66kg. The Stem & Leaf diagram shows that more girls than boys have a weight less than 60kg, but more boys than girls have a weight more than 60kg. These results are based on a random sample of 25 boys and 25 girls from year 11
Scatter Graphs to look for correlation and relation between boy and girls in year 11. Also attempt to prove my hypothesis
The graph above shows that there is a positive correlation with most of the results shows that the taller you are the more you weigh.
The graph above shows no correlation. In this graph it shows that height does not affect your weight when it comes to girls.
Standard Deviation:
I now will make comparisons between the year 11 students. I think this will give me good information on how much change there is between boys and girls in year 11. I will be doing standard deviation to find out whether how much the deviation of height and weight from the mean will differ from boys to girls. From doing this investigation I will have established that better and clearer results are obtained when boys and girls are separated. So for the standard deviation I will be comparing year 11 boys to the year 11 girls.
I predict that the boys in year 11 will have greater Standard Deviations for both height and weight. The reason for this prediction is that by year 11 boys will be taller and generally weigh more then the year 11 girls. Plus the range on heights and weights will be more, and so therefore the deviation about the mean will be less strong. So therefore the deviation of the range of heights and weights will be more accurate.
Standard deviation so I will be able to see whether boys or girls have heights and weight more concentrated about the mean.
The average height for boys in year 11 is;
152 + 177 + 181 + 172 + 162 + 155 + 169 + 168 + 179 + 158 + 182 + 196 + 165 + 194 + 150 + 168 + 165 + 168 + 162 + 192 + 184 + 167 + 157 + 163 + 173
25
= 170cm
Variance = 3288 = 131.52
25
Standard Deviation = √131.52
= 11.5 (to 1 d.p)
Standard deviation so I will be able to see whether boys or girls have heights and weight more concentrated about the mean.
The average weight for boys in year 11 is;
60 + 57 + 72 + 58 + 56 + 54 + 55 + 50 + 72 + 54 + 66 + 93 + 58 + 80 + 35 + 63 + 47 + 58 + 50 + 45 + 78 + 60 + 54 + 59 + 50
25
= 59kg
Variance = 3629 = 145.16
25
Standard Deviation = √145.16
= 12 (to 2 sig fig)
Standard deviation so I will be able to see whether boys or girls have heights and weight more concentrated about the mean.
The average height for girls in year 11 is;
160 + 163 + 168 + 163 + 163 + 165 + 168 + 152 + 175 + 172 + 158 + 160 + 157 + 152 + 174 + 162 + 170 + 161 + 163 + 158 + 162 + 133 + 178 + 165 + 160
25
= 162m
Variance = 1947 = 77.88
25
Standard Deviation = √77.88
= 8.8 (to 1 d.p)
Standard deviation so I will be able to see whether boys or girls have heights and weight more concentrated about the mean.
The average weight for girls in year 11 is;
54 + 44 + 54 + 47 + 48 + 66 + 48 + 38 + 56 + 60 + 54 + 48 + 48 + 44 + 39 + 42 + 63 + 45 + 38 + 48 + 54 + 55 + 55 + 59 + 60
25
= 51kg
Variance = 1446 = 57.84
25
Standard Deviation = √57.84
= 7.6 (to 1 d.p)
Conclusion:
After completing my investigation, I felt it was a challenge to find out the relationships between height and weight I feel I have conducted a successful investigation.
The plan I made I felt made my investigation easier to do and make more sense, this allowed me to get good results that I could compare to each other I would also be able to check whether or not their was relationship within my data for height and weight for the year 11 boy and girls.
I think it was very important that I used random sampling to find the 25 boys and 25 girls for year 11 because this was the only way I could be sure my results would be fair and totally unbiased.
For year 11 boys I hypothesised that the taller you are the more you are to weigh, I decided to scatter graphs for just the boys and girls separately. This is because I thought that having separate graphs boys and girls separately gave stronger correlation and so therefore doing the mixed group would be a waste of time
For year 11 boys I found that there was strong positive correlation meaning that my hypothesis was correct. For girls there was weaker correlation than the boys.
For median, lower quartile, upper quartile there was never a difference of more than three, indicating that for height and weight boys and girls are very similarly match when It come to things like their interquartile range.
For the standard deviation of my results for year 11 boys and girls, I was sure that the girls would have smaller standard deviations then the boys. This is because boys tend to be taller and weigh a lot more then girls.
Overall I believe I have proved my hypothesis correct by proving boy weigh more then girls.