Key: 6/9 = 69
10/0 = 100
Cumulative Frequency
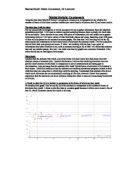
The cumulative frequency graph showing the above table is on a separate paper.
Left hand
I have collected 100 IQ number from the Mayfield High School based on left handed girls. The data is from different ages and year’s group.
I collected the following IQ numbers:
98, 104, 116, 94, 115, 104, 76, 94, 88, 96, 100, 95, 88, 104, 117, 110, 105, 103, 103, 107, 105, 96, 94, 106, 107, 104, 94, 102, 104, 113, 100, 106, 96, 100, 102, 103, 107, 106, 100, 84, 103, 106, 107
102, 109, 103, 103, 100, 100, 88, 78, 100, 109, 103, 97, 106, 103, 100, 96, 108, 113, 100, 107, 101, 116, 96, 100, 111, 100, 106, 110, 112, 114, 97, 93, 90, 107, 86, 120, 114, 116, 103, 104, 116, 96, 105
103, 108, 117, 104, 120, 109, 110, 108, 108, 98, 109, 101, 72, 102
Steam and Leaf diagram
Key: 7/2 = 72
10/0 = 100
Cumulative frequency
The cumulative frequency graph showing the above table is on a separate paper.
Conclusions
Girls right handed
Mean = 10130 ∕ 100 = 101.30
Girls left handed
Mean = 10150 ∕ 100 = 101.50
The median on right handed is lower than left handed. The mean of the left-handed girls is slightly higher than right-handed girls. These show us that the hypothesis is wrong. The girls left-handed have an IQ number higher than the girls right handed.
Now, I am going to investigate the right and left-handed boys IQ number and relate them to the girls IQ number.
For explore the right and left-handed boys IQ number I am going to use a hypothesis.
Hypothesis – The right-handed boys have an IQ number higher than the left-handed boys.
The following table show the right and left-handed boys in the school.
Right hand
I have collected 100 IQ number from the Mayfield High School based on right hand boys. The data is from different ages and year’s group.
I collected the following IQ numbers:
101, 116, 101, 90, 97, 107, 101, 99, 109, 101, 100, 97, 112, 92, 103, 100, 100, 100, 101, 116, 103, 105, 99, 90, 108, 100, 71, 100, 97, 102, 100, 100, 98, 98, 103, 91, 104, 104, 97, 103, 72, 97, 106, 107, 108, 117, 74, 97, 92, 102, 89, 103, 91, 106, 103, 116, 100, 121
102, 89, 119, 106, 88, 90, 103, 80, 76, 106, 102, 84, 117, 100, 103, 91, 110, 115, 98, 98, 78, 83, 108, 112, 109, 100, 100, 78, 86, 91, 107, 102, 102, 101, 100, 103, 101, 104, 81, 104, 106, 104
Then, I draw a stem and leaf diagram to group the data.
Stem and leaf diagram
Key: 8/9 = 80
10/3 = 103
Cumulative Frequency
The cumulative frequency graph showing the above table is on a separate paper.
Left hand
I have collected 100 IQ number from the Mayfield High School based on left handed boys. The data is from different ages and year’s group.
I collected the following IQ numbers:
91, 103, 102, 103, 98, 100, 108, 100, 102, 107, 106, 103, 100, 98, 100, 106, 94, 102, 100, 88, 100, 101, 109, 100, 112, 116, 74, 100, 92, 103, 107, 112, 92, 98, 103, 100, 126, 103, 98, 99, 78, 100, 116, 89, 86, 100, 102, 90, 109, 103, 94, 116, 113, 105, 101, 88, 101, 116, 110, 90, 112, 131, 96, 110, 87, 74, 96, 102, 90, 109, 101, 112, 100, 91, 103, 113, 104, 106, 110, 90, 86, 127, 97, 112, 102, 99, 110, 117, 106, 102, 100, 92, 100, 111, 117, 99, 90, 87, 108, 124
Steam and Leaf diagram
Key: 8/8 = 88
12/4 = 124
Cumulative frequency
The cumulative frequency graph showing the above table is on a separate paper.
Conclusions
Boys right handed
Mean = 9890 ∕ 100 = 98.90
Boys left handed
Mean = 10090 ∕ 100 = 100.90
Mean and Median table
The mean and median on right-handed boys is lower than the left-handed boys. This shows us that the hypothesis is wrong. The left-handed boys have an IQ number higher than the right-handed boys.
Overall conclusions
In this section I am going to relate the results of the girls and boys IQ number. I am going to say which gender has higher IQ number. The first hypothesis demonstrated that the girls left-handed have a higher IQ number than right-handed girls. The second hypothesis showed that the boys left-handed have a higher IQ number than the right handed boys. For each hypothesis I have collected 200 IQ numbers from Mayfield High School database based on right and left hand students.
What the results prove?
The results prove that the girls have a superior average of IQ number. But in comparison of boys and girls Descriptive Classifications of Intelligence Quotients, the girls left-handed with a mean of 101.50 have a elevated average of IQ number than the boys left handed with 100.90.
Incorrect data displayed on the Mayfield High School datasheet
In this section I am going to look at the Mayfield school datasheet and try to find data that does not makes any sense.
I found the following incorrect data:
- Height – 4.65 m
- Average number of hours TV watched per week – 1000000 hours, 170 hours and 190 hours
Maximum possible = 24 × 7 = 168 hours
- IQ – 240 which is impossible
- No of siblings – 17 - It can be possible but I don’t believe