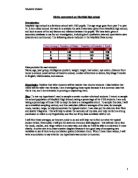
IQ Averages
Level 2
Level 3
Level 4
Level 5
Level 6
Using the cumulative frequency graph
Median = n ÷ 2= 31 ÷ 2 = 15
Lower quartile = n ÷ 4 = 30 ÷ 4 = 7.5
Upper quartile = 3n ÷ 4 = 90 ÷ 4 = 22.5
Inter quartile range = upper quartile – lower quartile
Using the cumulative frequency graph
Median = n ÷ 2= 31 ÷ 2 = 15
Lower quartile = n ÷ 4 = 30 ÷ 4 = 7.5
Upper quartile = 3n ÷ 4 = 90 ÷ 4 = 22.5
Inter quartile range = upper quartile – lower quartile
Using the cumulative frequency graph
Median = n ÷ 2= 31 ÷ 2 = 15
Lower quartile = n ÷ 4 = 30 ÷ 4 = 7.5
Upper quartile = 3n ÷ 4 = 90 ÷ 4 = 22.5
Inter quartile range = upper quartile – lower quartile
Using the cumulative frequency graph
Median = n ÷ 2= 31 ÷ 2 = 15
Lower quartile = n ÷ 4 = 30 ÷ 4 = 7.5
Upper quartile = 3n ÷ 4 = 90 ÷ 4 = 22.5
Inter quartile range = upper quartile – lower quartile
Using the cumulative frequency graph
Median = n ÷ 2= 31 ÷ 2 = 15
Lower quartile = n ÷ 4 = 30 ÷ 4 = 7.5
Upper quartile = 3n ÷ 4 = 90 ÷ 4 = 22.5
Inter quartile range = upper quartile – lower quartile
Extension
To develop my investigation and understanding, I have decided to do some widespread research. In the following section I will look at the data which states what IQ a person required to attain a level 4 KS2 result. Next I will narrow it down to year 7 and year 11 and contrast the set of results. I will try to conclude if the average IQ requires for a level 4 has amplified or reduced which will designate if the tests have become harder or easier. The conclusion of my earlier investigation is included at the end of the investigation along side with my analysis and evaluation. Samples – Level 4
Year 7 Year 11
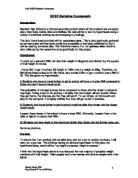
IQ Averages
Year 7
Year 11
Using the cumulative frequency graph
Median = n ÷ 2= 31 ÷ 2 = 15
Lower quartile = n ÷ 4 = 30 ÷ 4 = 7.5
Upper quartile = 3n ÷ 4 = 90 ÷ 4 = 22.5
Inter quartile range = upper quartile – lower quartile
Using the cumulative frequency graph
Median = n ÷ 2= 31 ÷ 2 = 15
Lower quartile = n ÷ 4 = 30 ÷ 4 = 7.5
Upper quartile = 3n ÷ 4 = 90 ÷ 4 = 22.5
Inter quartile range = upper quartile – lower quartile
Analysis and Conclusion
The level 2 results have an IQ of 80. According to the cumulative frequency graph the median is 77. This shows that both these figures are comparable indicating that the data is well spread. This is further recognized by the small inter-quartile rang of 7.45.
The level 3 results have an IQ of 89.9. According to the cumulative frequency graph the median is 90.5. The inter- quartile range is once again small 6. This shows that the data is well spread.
The level 4 results have an IQ of102. According to the cumulative frequency graph the median is 102. This shows that both these figures are comparable indicating that the data is well spread. This is further recognized by the small inter-quartile rang of 3.
The level 5 results have an IQ of 110.25. According to the cumulative frequency graph the median is 110. The inter- quartile range has increased to 10. Which shows that there is a wide variation in the data.
The level 6 results have an IQ of116. According to the cumulative frequency graph the median is 117. This shows that both these figures are similar indicating that the data is well spread. However the inter-quartile range is 11.5.
‘My prediction is that the higher the IQ the higher the KS2 results will be.’
My hypothesis ‘the higher the IQ the higher the KS2 results will be’ my results shows that the higher the IQ the higher the KS2 results will be hence making my prediction correct. My averages show an increase in IQ average for and increasing KS2 Maths result. For example the IQ, average for level 2 is 80 and the IQ average for level 3 is 89.9 which is an increase this trend carries on through the investigation.
I am really pleased with my results as they are reliable. I am optimistic that my hypothesis was proven correct. However I would’ve liked to collect more samples for level 2 and level 6 as there was not enough data although there was plenty for levels 3,4 and 5.
To develop my investigation of IQ and KS2 results I decided to compare the IQs of the Year 7 pupils to that of Year 11 pupils, all whom have achieved level 4 in KS2 Maths.
The IQ average for level 4 in the Year 7 was 102.54. The cumulative frequency graph shows a median of 102 and an inter quartile range of 4 showing that the data is well spread. The IQ average for level 4 in the year 11 is 102.63. The median from the cumulative graph is 102 and the inter-quartile rang is 4.
However, a more interesting study is in the averages. The level 4 IQ average for year 7 is 102.63 and the IQ average for year 11 is 102.45 which is a minor decrease which shows that test may be getting harder over time.
Evaluation
In terms of my expectations, it showed that the higher the IQ the higher the KS2 results proved to be a success because it matched my hypothesis. I had accurate data and made them onto tables, graph and box plots to test my hypothesis. My results were all clear and it was easy to originate a conclusion.
However, I did perceive some complications involving the investigation. The first problem being is some of the abnormal curves on my cumulative frequency graph. Instead of having a smooth and consistent line, some graph show irregularity (graph 1 level 2). This could have been due to two reasons. The first reason could be mistakes in the data. There could have been false information given. The second reason could be due to the small sample size of level 2 and level 6.
Although I have some anomalous results I still consider my data is to a certain extent accurate as it has helped me to prove my prediction. Furthermore I think my conclusions are reliable as I believe if I done this investigation again I will have similar results. I think my results are valid because I have similar results to my class members who have done the same investigation.
If I had the chance to conduct this investigation in the future. I would choose a larger sample size; this may eliminate the inconsistency in graphs.