Contents page
Introduction
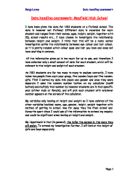
In this statistical enquiry I will be investigating the relationship between heights and weights and also some more hypotheses, I will investigate this data using the Mayfield high school data this is data on students in all years in a fictitious school the data for the students contain there name, age,, height, weight, I.Q, however once I had got my data I had to delete the unnecessary columns because they were no use to me during this project.
For me to prove my hypotheses I first of all would need to select a sample size which I feel will help me prove my hypotheses, once I have collected my data I will then go on to process them into a range of tables, graphs and charts I will do this because it will help me to notice any patterns in my data and also help me establish whether my data is correct.
After the processing of my data I will then go on to analyse my data I will do this because it will help me find any clear patterns or relationships that will help me prove my hypothesis.
Once I have done all that I will then go on to my evaluation on this part of the investigation I will evaluate on how I went on my project saying where I felt I done well in and also where I felt I could of done better in and finally I will say how I could make this project better if I was to do it again in the future.
GCSE HANDLING DATA COURSEW0RK
PLANNING
This is my planning section. In this section I will explain the how I am going to prove that the taller you are the heavier you are Mayfield high school data (secondary data) and then processing them into the relevant tables, graphs and charts and then go on to calculate the averages to prove my hypotheses and I finally will analyse my data to see where I went wrong and right.
Hypothesis: the taller you are the heavier you are
Sub hypotheses: year 11 boys are heavier than year 9 boys
Year 9 girls are taller than year 7 girls
Boys are heavier than girls
Key stages 4 are heavier than key stage 3
I have chosen these hypotheses because I feel that heights and weights are easy to compare with each other and easy to establish relationships, and this is the stage in life which you grow so it would be easier for me to prove my hypotheses.
The type of data I am going to use is secondary data the data I am going to use is the Mayfield high school data this is a database on all students in Mayfield high school showing all the students details e.g. height, weight, IQ and names. I am using this data because it is already collected so there is less chance of me making a bias occurs.
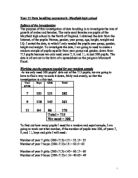
To prove my hypotheses I will need to know what my population is and what sample size I am going to take from it. My population is boys and girls in year 7-11, so my sample size would be about 7-10% of the overall population. I have chosen this size because I feel that this size would give a fair representation of the entire population.
I am going to collect my data using stratified sampling I have chosen this technique because it covers all aspect of the sample size (strata) which will represent all of the population equally it also gives me an idea of how much data to collect by using the calculation for it however bias can still occur with me using this technique because I could make a systematic error.
Once I have collected all my data I will process it into a vary of tables, graphs and charts starting with a stem and leaf diagram I will do this because it will make it easier for me to calculate the averages and the range along with the upper and lower quartiles for each group. I will then but m data into a box plot I will do this because it will show me how far my lowest and highest totals are from my upper and lower quartiles and whether it has a positive or negative spread. I will finally go on to put my data into a scatter graph I will do this because it will be easy for my to prove my main hypothesis because if there is a positive correlation between heights and weights that will suggest the taller you get the more you will weight.
Once I have processed my data I will compare and analyse my graphs to see whether any of them can prove my hypotheses or help prove them e.g. if there is a positive correlation between heights and weights that will suggest the taller you get the more you will weigh.
During my project I will also using a body mass index (bmi) I will be using this because it will help me determine if a person is over weight, obese and under weight therefore a anomaly To find a persons BMI you have to divide the weight by height and then to find out whether that person is a anomaly or not you have to put them in there category and see if they are out side the normal weight for there age..
Finally for my conclusions I expect to write whether my hypotheses were correct however I could improve the accuracy of my conclusion by going over the entire project and see if everything I had done had been executed properly this will help give me a detailed conclusion covering the whole of my project and how I felt it went.
Scatter graphs
I have put my data into scatter graphs because the scatter graph compares the two axes and shows relationships between the data whether it is positive or negative correlation. On my graphs would be the r squared values these values give you an indication on how positive or negative the correlation of the data is depending on how close the values are to 1 or 0 the closer it is to 0 the more negative it is and the closer it is to 1 the more positive it is.