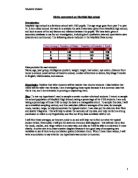
Here is the graph of year 7 boys:
And here is the graph for year 11 boys:
The average weight for Year 7 boys is 42.5 kg.
The average weight for Year 11 boys is 57.3 kg.
The 2 graphs don’t really show the relationship between weight and age because I only have 10 data. I am going to use more data in the main project.
The 2 graphs show Year 11 boys are heavier than year 7 boys because the heaviest in year 7 is only 45 kg and on the other hand year 11 boys have 60 as the heaviest in my data.
3. People who are heavier have the lower IQ
The graphs show that there is no correlation between the relationship between IQ and weight. But if I use more data it might show the correlation.
Analysis
I did cumulative frequency graphs for the first and the second hypotheses and scatter graph for the third hypothesis.
The results can be improved by using more data in different year group. It will prove my hypotheses easier. I will use more data when I do the project. I will also use stratified sample to find out the ratio for each year group.
Stratified Sample
I am going to use Stratified Sample for this project.
Here is the table show the number of pupils in Mayfield high school.
I used stratified sample because it is easier to find out the answer and it is more accurate. It gives me the ratio of the different gender. If I find the date randomly, it will not be that accurate without the ratio. The reason why the ratio is important is because different year group have different number of people. For year 7 I have to find 6 samples randomly, year 8 I have to find 6 for boys and 5 for girls and so on to make it up to 50. For my second hypothesis, Year 11 boys are heavier Year 7 boys, I have to do it differently because I only need to use 2 year group. Therefore I have to find out the ratio of boys in Year 11 and Year 7 to make the data up to 50.
Data
Here is my data I am going to use for hypothesis 1 and 2:
One of the data from the ordinary data is wrong:
There is an error in the weight column because it is impossible to have 5kg of weight when a person is 13 years old.
And this data for my second hypothesis:
Investigation of hypothesis 1
Boys are heavier than girls
I predict that boys are heavier than girls. Now, I am going to do 2 Cumulative frequency graphs. 1 for girls and the other for boys then I will draw a box and whisker plot to compare the 2 sets of data. Then I will find out the mean and standard deviation.
All the data have been analysis by stratified sample.
Here is the data for the girls:
Here is the cumulative frequency graph for girl:
Here is the data for the boys
Here is the cumulative frequency for the boys:
I have drawn 2 cumulative frequency graphs. And now I am going to draw a box and whisker plot by finding out the median, upper quartile, lower quartile of the weight of boys and girls.
Girl’s weights
Median: 51.5kg
Upper quartile: 55.5kg
Lower quartile: 42kg
Inter-quartile range: Upper quartile – Lower quartile.
Inter-quartile range: 55.5- 42= 13.5
The box and whisker plot shows that the median is closer to the upper quartile than the lower quartile so it is a negatively skewed.
Boy’s weights
Median: 52.5kg
Upper quartile: 57.5kg
Lower quartile: 43kg
Inter-quartile range: 57.5- 43= 14.5
This box and whisker plot also shows that the median is closer to the upper quartile than the lower quartile so it is a negatively skewed.
I will find out the mean of girls and boys
I will divide them by 25 because there are 25 Female and 25 Male.
Female 1258÷25= 50.32
Male 1311÷25= 52.44
The overall mean is 51.38kg
I will now find out the standard deviation for the girls and boys
This is the standard deviation for the girls:
The formula for calculating a standard deviation = √Σ(x-x)2 ÷ n
Σ= the sum of, x= midpoint, x= mean, n= Total frequency.
151.78+ 53.58+ 5.38+ 7.18+ 58.98+ 160. 78+ 312.58
=750.26
√750.26÷ 25
=√30.0104
=5.48
This is the standard deviation for the boys:
208.51+ 89.11+ 19.71+ 0.31+ 30.91+ 111.51+ 212.11
=702.17
√702.17÷ 25
=√28.0868
=5.30
Conclusion
I have found out that boys are most likely to be heavier than girls, so my first hypothesis is correct. I have proved it by doing 2 cumulative frequency graphs and 1 box and whisker diagram. The average weight for girls is 50.32kg and for boys is 52.44kg which means boys are heavier than girls. From my box plot I can see the median for boys is higher than girls. Now, I am going to investigate my second hypothesis. I will use the other set of data. The data is shown on pages 8 and 9.
Investigation of hypothesis 2
Year 11 boys are heavier than Year 7 boys
I am going to draw 2 cumulative frequency graphs. Then I am going to make a box and whisker diagram to compare the two.
Here is the data for the Year 7 boys:
Here is the cumulative frequency for Year 7 boys:
Here is the data for Year 11 boys:
Here is the cumulative frequency for Year 11 boys:
I have drawn 2 graphs. And now I am going to draw a box and whisker diagram by finding out the median, upper quartile, lower quartile of the weight of year 7 boys and year 11 boys.
Year 7 boy’s weight:
Median: 42.5kg
Upper quartile: 47.5kg
Lower quartile: 37.5kg
Inter-quartile range: 47.5-37.5= 10
In this box and whisker plot I can see both the upper and lower quartiles are equal to the median so it is symmetrical.
Year 11 boy’s weight:
Median: 58.5kg
Upper quartile: 68kg
Lower quartile: 56kg
Inter-quartile range: 68-56=12
This box and whisker plot shows me that the lower quartile is closer than the median so this is positive skewed.
I will find out the mean of Year 7 and Year 11 boys:
There are 32 year 7 boys and 18 year 11 boys so I will divide the total weight of year 7 boys by 32 and 11 boys by 18
Year 7 boys 1397÷ 32= 43.66
Year 11 boys 1096÷ 18= 60.89
Now I am going to find out the standard deviation for Year 7 and 11 boys.
The formula for calculating a standard deviation = √Σ(x-x)2 ÷ n
Σ= the sum of, x= midpoint, x= mean, n= Total frequency.
This is the standard deviation for year 7 boys.
426.84+245.24+113.64+32.04+0.44+18.84+87.24+205.64+374.04+592.44
=2096.4
=√2096.4÷32
=√65.5125
=8.09
This is the standard deviation for year 11 boys.
320.05+166.15+62.25+8.35+4.45+50.55+146.65+292.75+488.85
=1540.05
=√1540.05÷18
=√85.5583
=9.24
Conclusion
I have found out that year 11 boys are heavier than year 7 boys. The median of year 11 boys is 58.5kg and a year 7 boy is 42.5kg. The average weight for year 7 boys is 43kg and for year 11 boys is 60.77kg. My hypothesis was correct. I have proved it by doing 2 cumulative frequency graphs and 1 box and whisker diagram. Now I am going to investigate the third hypothesis. I will do a scatter graph to find out the relationship between weight and IQ.
Investigation of hypothesis 3
People who are heavier have the lower IQ
I predict that people who are heavier have the lower IQ. I will do a scatter graph to find out the relationship.
Here is the graph to show the relationship between weight and IQ:
I did a scatter graph and I plot a line of best fit. The graph shows that there is a very weak negative correlation between weight and IQ. In my pilot sample there is no correlation between them because I only had 10 samples and now I have 50 samples. So it shows the correlation clearer. There are some outliners on the graph because they might be the unfit people.
Conclusion
I had found out that there is a weak negative correlation between weight and IQ. This means that if the weight is higher the IQ maybe lower. My hypothesis is correct. I have proved it by doing the scatter graph.