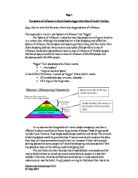
The sphere of influence in Brent Cross is bigger than that of North Finchley - My aim is to find the area, which has a bigger sphere of influence.
The sphere of influence in Brent Cross is bigger than that of North Finchley Aim: My aim is to find the area, which has a bigger sphere of influence. The keywords in my aim was "sphere of influence" and "bigger" The "Sphere of influence" means the area that people are willing to travel to in a certain area. Although the shops that are in that shopping area affect the sphere of influence, the transport and ease to get there along with the rivalry from other shopping districts. Here are some examples of shops with an area of influence: Boots Chemist prefers to have an area of influence of 10,000 people, Marks and Spencer prefer to have an area of influence of 50,000 people and Sainsburys prefer 60,000 people. "Bigger" from peoples point of view means: * "...More space" * "Large amount of space" In the Oxford Dictionary I looked up "bigger" this is what it meant, * Of considerable size, amount, intensity... * Of a large or the larger size... In my opinion the things that will make a better shopping area than a different location would be to have a large variety of shops. These things would include Food, Electrics, Toys shops, sweet shops, jewellery and banks. The amount of parking spaces would be good because if newcomers want to explore the place then they will have somewhere to park their car, however if their isn't enough parking spaces then some people will leave

The fencing problem 3-4pages
The Fencing Problem The problem to be solved is that a farmer needs to find the shape that will have the largest area when it has a perimeter of 1000m, so she can fence off a plot of level land. To do this I will have to look at several shapes and investigate a pattern. My prediction is that all the regular shapes will have the largest area. General Information sqrt = square root, A = area, P= perimeter, x^2=x squared, L= Length, W= width x/1/3=x and one third, n=number of sides, PI=â??,r=radius, C= circumference All diagrams not drawn to scale. Investigating different rectangles [IMAGE] All the rectangles must have a perimeter of 1000m. I have to find the rectangle with the largest area. First I will draw a few shapes to show you a pattern. As you can see, the areas of the rectangles get larger as the difference between the length and width get smaller. Now to find the maximum area I will make a spreadsheet in Excel, along with a graph. [IMAGE] [IMAGE] When entering values for the length I could not have entered 0m or 500m because the shape would not be a rectangle then, it would have been a straight line. The areas in the table increase and then decrease. This proves that the areas of the rectangles get larger as the difference between the length and width get smaller. As observed from the spreadsheet and the line graph,

To analyse the performances of two batsmen from the Indian cricket team and two batsmen from the Australian cricket team and to predict their probable scores in the forthcoming matches between them.
Mathematics Project STATEMENT OF TASK This project deals mainly with the topics of Statistics and Probability. The main elements of these two topics that have been used in this project are 1.) Histograms (Statistics) and 2.) Standard Deviation ( Statistics) and 3.) Probability density functions (Probability). This project is aimed at two different topics. First of all it calculates the consistency of four of the best batsmen in the world. These are - Sachin Tendulkar, Rahul Dravid, Ricky Ponting and Matthew Hayden. The consistency has been calculated by using the standard deviation formula. The standard deviation formula calculates the amount, the batsman's scores deviate from the mean. The mean is calculated using the frequencies of the player's scoring at every ten run interval. This will give the consistency of the batsman about his mean. The second part of this project is aimed at predicting the average scores of these batsmen in the forthcoming tournament between Australia and India. This is extremely viable as all four of the batsmen belong to one of the two countries. The scores are predicted by using the probability density functions of the career graphs of these four batsmen. First of all histograms are drawn which portray how often the batsmen have scored at every ten run interval. Secondly the top right hand corners of these histograms are joined
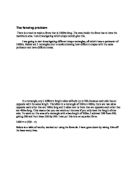
The Fencing Problem There Is a Need To Make a Fence That Is 1000m Long.
The fencing problem There is a need to make a fence that is 1000m long. The area inside the fence has to have the maximum area. I am investigating which shape would give this. </span> I am going to start investigating different shape rectangles, all which have a perimeter of 1000m. Below are 2 rectangles (not to scale) showing how different shapes with the same perimeter can have different areas. In a rectangle, any 2 different length sides will add up to 500, because each side has an opposite with the same length. Therefore in a rectangle of 100m x 400m, there are two sides opposite each other that are 100m long and 2 sides next to them that are opposite each other that are 400m long. This means that you can work out the area if you only have the length of one side. To work out the area of a rectangle with a bas length of 200m, I subtract 200 from 500, giving 300 and then times 200 by 300. I can put this into an equation form. 000 = x (500 - x) Below is a table of results, worked out using the formula. I have gone down by taking 10m off the base every time. Using this formula I can draw a graph of base length against area. As you can see, the graph has formed a parabola. According to the table and the graph, the rectangle with a base of 250m has the greatest area. This shape is also called a square, or a regular quadrilateral. Because I only measured to the
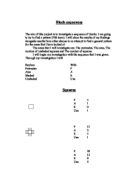
Block sequences
Block sequences The aim of this project is to investigate a sequence of blocks. I am going to try to find a pattern (Nth term). I will place the results of my findings alongside results from other shapes in an attempt to find a general pattern for the areas that I have looked at The areas that I will investigate are: The perimeter, The area, The number of unshaded squares and The number of squares. I will begin my investigation with the sequence that I was given. Through my investigation I will Replace With Perimeter P Area A Shaded S Unshaded Uns Squares P 4 A S 0 Uns P 2 A 5 S 4 Uns P 20 A 3 S 8 Uns 5 P 28 A 25 S 2 Uns 3 P 36 A 41 S 6 Uns 25 I will now put all the figures I have recorded into tables and find the Nth term Perimeter Diagram No of sides 4 2 2 3 20 4 28 5 36 4 2 20 28 36 8 8 8 8 Now that I have found the common difference in the sequence I can work out the Nth term. Diagram 8N - = Perimeter 8 4 = 4 2 6 4 = 2 3 24 4 = 20 4 36 4 = 28 5 40 4 = 36 The Nth term for the perimeter is 8N- 4 I will now follow the same steps to work out the Nth term for the Area, number of shaded and the number of unshaded. Area Diagram Number of squares 2 5 3 3 4 25 5 41 5 3 25 41 4 8 12 16 4 4 2A = 4 A = 2 Nth term = 2N2 - 2N + 1

Determination of ethanol in beer by gas liquid chromatography.
DETERMINATION OF ETHANOL IN BEER BY GAS LIQUID CHROMATOGRAPHY Summary The reason why Ethanol can be determined by GLC is because it is volatile and thermally stable at the operating temperature of GLC. Gas - Liquid chromatography (GLC) has found widespread application in many areas of chemical analysis and a wide range of compounds can be examined. (1). Objectives - To determine accurately the ethanol content of a can of beer by gas liquid chromatography using external standardisation with an internal standard. 2- To construct a calibration curve of absolute and relatives peaks areas and use this data to determine concentration of ethanol in the unknown sample. Key results As the experimental results shows the graph showing the peak area of ethanol gives the ethanol concentration of beer solution as 4.17% and the graph showing the ratio peak area gives the ethanol concentration of beer solution as 3.47%. Main conclusion When the theoretical (labelled) value of beer concentration which is 4% v/v, compared to both experiment results, it found to lower than 4.12% and higher than 3.47%. Introduction Chromatograph is a separation technique where component molecules in a sample mixture are transported by a mobile phase over a stationary phase. The mobile phase may be a gas or a liquid (solvent system) and the stationary phase may be a liquid film on the surface of an
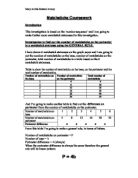
Investigation to find out the number of matchsticks on the perimeter in a matchstick staircase using the GENERAL RULE.
Matchsticks Coursework Introduction This investigation is based on the 'number sequence' and I am going to make further more matchstick staircases for this investigation. Investigation to find out the number of matchsticks on the perimeter in a matchstick staircase using the GENERAL RULE. I have drawn 6 matchstick staircases on the graph paper and I am going to put the number of matchsticks on the base, number of matchsticks on the perimeter, total number of matchsticks in a table based on the 6 matchstick staircases. Table to show the number of matchsticks on the base, on the perimeter and the total number of matchsticks. Number of matchsticks on the base Number of matchsticks on the perimeter Total number of matchsticks 4 4 2 8 0 3 2 8 4 6 28 5 20 40 6 24 54 And I'm going to make another table to find out the difference on perimeter from the number of matchsticks on the perimeter. Number of matchsticks on base 2 3 4 5 6 Number of matchsticks on perimeter 4 8 12 16 20 24 4 4 4 4 4 Perimeter difference From this table I'm going to make a general rule, in terms of letters. Number of matchsticks on perimeter = P Number of base = b Perimeter difference = 4 (always) When the perimeter difference is always the same therefore the general rule will be
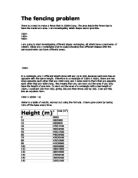
The fencing problemThere is a need to make a fence that is 1000m long. The area inside the fence has to have the maximum area. I am investigating which shape would give this.100m
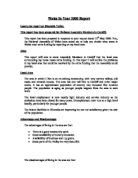
The fencing problem There is a need to make a fence that is 1000m long. The area inside the fence has to have the maximum area. I am investigating which shape would give this. 00m 50m 400m I am going to start investigating different shape rectangles, all which have a perimeter of 1000m. Below are 2 rectangles (not to scale) showing how different shapes with the same perimeter can have different areas. 350m In a rectangle, any 2 different length sides will add up to 500, because each side has an opposite with the same length. Therefore in a rectangle of 100m X 400m, there are two sides opposite each other that are 100m long and 2 sides next to them that are opposite each other that are 400m long. This means that you can work out the area if you only have the length of one side. To work out the area of a rectangle with a bas length of 200m, I subtract 200 from 500, giving 300 and then times 200 by 300. I can put this into an equation form. 000 = x(500 - x) Below is a table of results, worked out using the formula. I have gone down by taking 10m off the base every time. Height (m) x Area (m2) 0 500 0 0 490 4900 20 480 9600 30 470 4100 40 460 8400 50 450 22500 60 440 26400 70 430 30100 80 420 33600 90 410 36900 00 400 40000 10 390 42900 20 380 45600 30 370 48100 40 360 50400 50 350 52500 60 340 54400 70 330 56100
Local area report on Rhondda Valley.
Wales In Year 2000 Report Local area report on Rhondda Valley. This report has been prepared for National Assembly Members in Cardiff. This report has been prepared in response to your request dated 12th May 2000. You, the National Assembly of Wales have asked me to help you decide what areas in Wales need extra funding by reporting on my local area. Aims This report will aim to show Assembly Members in Cardiff that the local area surrounding my home needs extra funding. In this report I will outline the problems in my local area that could be resolved by the extra funding that the Assembly could provide. Local Area The area in which I live is an ex-mining community, with very narrow valleys, old roads and terraced houses. The area has one rail link to Cardiff and other major towns. It has an approximate population of seventy two thousand five hundred people. The population is aging as younger people migrate from the area to seek work. The local employment is now mostly light industry and service industry as the coalmines have been closed for many years. Unemployment now runs at a high level locally, particularly for younger people. The leisure facilities in Rhondda are improving but are not satisfactory given the size of the population. Advantages and Disadvantages The advantages of living in the area are that: * There is a good community spirit. * Good
Estate agents - It is essential that my current furniture fits into the house and into the chosen rooms
Chris Seaman Plan In the near future, I am going to purchase a terraced house. However it is essential that my current furniture fits into the house and into the chosen rooms. To check that this is so, I shall produce scale drawings of the house I have chosen, first by converting the imperial units into meters and then into centimetres for which a scale can be derived. I shall also do this for each item of furniture for a chosen room. In order to check the accuracy of the calculations I will also be working out the actual figures using the dimensions given. Since most of my furniture will go into the living room, this is the room I shall choose. For this room I shall also calculate the amount of carpet required. I will also calculate both the volume and the area of the kitchen and the lounge for which I shall presume the height of the room is 2.5 meters. From the leaflet I have been given there are several problems I must overcome, such as the placement of widows, doors and stairs, which is not specified. I must however make a sensible guess where these could be and their size. Any other problems that I encounter, I shall overcome as and when they arrive. Calculations - Using a scale 1:30 for drawing dimensions. 1 inch = 2.5 cm Sitting room ~ 12'6 x 12'0 150" x 144" 375 x 360 cm (actual) 12.5 x 12 cm (in scale) Kitchen ~ 12'6 x 6'2 150" x 74" 375 x 185