Year 7 boys: 101
20% of 101 = 20.2 ≈ 20 boys
Year 7 girls: 113
20% of 113 = 22.6 ≈ 23 girls
Year 9 boys: 108
20 % of 108 = 21.6 ≈ 22 boys
Year 9 girls: 104
20% of 104 = 20.8 ≈ 21 girls
Year 11 boys: 116
20% of 116 = 23.2 ≈ 23 boys
Year 11 girls: 96
20% of 96 = 19.2 ≈ 19 girls
Secondary Data ~
Year 7’s from 2 years ago (Now Year 9’s.)
Boys: 104
20% of 104 = 20.8 ≈ 21 boys
Girls: 107
20% of 107 = 21.4 ≈ 21 girls
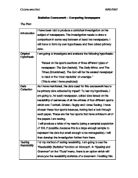
I have chosen to do a stratified sampling because it makes my investigation equal, fair, and it won’t make it biased.
For my Secondary Data, I have chosen to do systematic sampling for my data collection because it is a simple and quick method. Systematic sampling is a regular pattern which is used to choose the sample. Every item in the population is listed a starting point is randomly chosen and then every nth term is selected.
For my Primary Data, I have chosen to do convenient sampling for my data collection because it is a very quick method, but it is also very highly likely that my Primary Data will be biased and unrepresentative because, I mat hose pupils who are my friends, or I may choose pupils that I know will make my hypothesis correct when it comes to calculating my data collection. I going to choose 4 different classes for the year 11 year group, the year 9 year group, and the year 7 year group. To choose the pupils I am going to select at least 4 boys and 4 girls at one time, and I am going to randomly point my finger to the first people I see in the classroom, but only to the correct number of boys and girls from that particular year group. After collecting my data, I found that my data isn’t biased as the teachers ended up choosing the pupils randomly.
Plan for collecting my Primary Data ~
I conducted a pre-test on myself to choose which time is better for counting the pulse. First, I tried timing my pulse for 15 seconds, but then I realized that this would not be as accurate, so I tried timing for 30 seconds. I found this length of time to be easier as I would only have to times the result by 2. If I timed my pulse for 1 minute, it is a fair amount of time, and although it would be a lot more accurate, but when I choose my pupils from their class, they may get restless and want to go back to their lesson. I also conducted a pre-test on collecting pupil’s temperature on myself. I used a thermometer, and held it in my hand. I thought it would be best to wait till the green line had stopped moving to each elevation. If I timed holding the thermometer, then the result in the temperature could be wrong, as the green liquid in the thermometer may not stop moving.
Secondary Data Sample ~
To select my secondary data, I am going to select the every 6th person on my data sheet. I am doing it this way to ensure it isn’t biased, and also it is quick and easy. This is systematic sampling as explained above. The data which I selected was supposed to be every 6th person, but some pieces of data was missing on the sheet, so I had to choose the one below, and start counting every 6th person again.
I am using the Spearman’s Rank Correlation Co-efficient to represent my Secondary data, because I want to find the extent to which my 2 sets of data correlate. It is a measure of the agreement between two data sets.
Spearman’s Rank Correlation Co-efficient for Secondary Data:
Girls ~
1- 6 ∑ D² = 1 - 6 x 17.5 = 0.98
n (n² - 1) 21(21² - 1)
A rank correlation co-efficient of 0.98 suggests that there is a very strong connection between the hours of exercise you do, and the pulse rate.
(See Scatter Graph)
Unfortunately, my scatter graph does not agree with my hypothesis, as it shows that the more exercise you do, the higher your pulse rate, but only ever so slightly, as my graph shows a weak positive correlation, therefore it almost shows that there is no relationship between the number of hours of exercise a person does and, if it affects their pulse rate in girls.
Spearman’s Rank Correlation Co-efficient:
Boys ~
-
6 ∑ D² = 1 - 6 x 2 = 0.99
n (n² - 1) 21(21² - 1)
A rank correlation co-efficient of 0.99 suggests that there is a very strong connection between the hours of exercise you do, and the pulse rate.
(See Scatter Graph)
Unfortunately, this does not agree with my hypothesis, as it shows that the more hours of exercise
you do, the higher your pulse rate. In this graph, it shows more clearly than the boys that there is
a connection between the amount of exercise you do and the pulse rate, as it shows a moderate
Positive correlation.
Primary Data ~