Statistics Coursework
Introduction
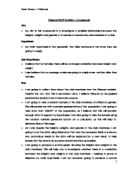
During this investigation I will be analysing data taken from Mayfield high school database, where by this data is stored electronically and is secondary data.
I will be focusing on male and female students in the age range of 11-14.
I will take a stratified sample of males and females in this age range. I anticipate that year sevens will be smaller and weight less than year nine and eights. To prove or disprove this theory i will carry out some statistical analysis as described bellow.
I will use Body Mass Index (BMI) to create different diagrams such as box and whisker diagram.
Hypothesis
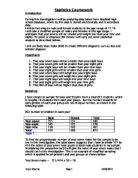
. That year seven boys will be smaller than year eight boys
2. That year seven girls will be smaller than year eight girls
3. That year eight boys will be smaller than year nine boys
4. That year eight girls will be smaller than year nine girls
5. That year seven boys will weigh less year eight boys
6. That year seven girls will weigh less year eight girls
7. That year eight boys will weigh less year nine boys
8. That year eight girls will weigh less year nine girls
9. That BMI of boys will be higher than that of girls
Sampling
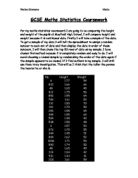
I have chosen to sample 50 boys and 50 girls from a total 813 students, which is roughly 16 students from each year group. But the number students of each gender of each year group are not of equal number, as shown in the following table.
KS3 number of children in each year:
Male
Female
Total
Year seven
51
31
282
Year eight
45
25
270
Year nine
18
43
261
Total
414
399
813
Table 1
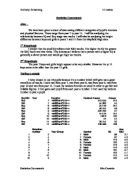
To find the proportionate number of year seven males for the sample to be use in this investigation, the table above suggests that I have to divide 151 by 414 the ration of year seven male pupils to total male students in my sample.
Multiplying this proportion by 50 will give the value of year seven males that I should use in this investigation. This is an example of stratified sampling which is applied for all genders and year groups as shown bellow.
Year Seven males = 151 / 414 × 50 = 18
Year Eight males = 145 / 414 × 50 = 18
Year Nine males = 118 / 414 × 50 = 14
Year Seven female = 131 / 399 × 50 = 16
Year Eight females = 125 / 399 × 50 = 16
Year Nine females = 143 / 399 × 50 = 18
Introduction
During this investigation I will be analysing data taken from Mayfield high school database, where by this data is stored electronically and is secondary data.
I will be focusing on male and female students in the age range of 11-14.
I will take a stratified sample of males and females in this age range. I anticipate that year sevens will be smaller and weight less than year nine and eights. To prove or disprove this theory i will carry out some statistical analysis as described bellow.
I will use Body Mass Index (BMI) to create different diagrams such as box and whisker diagram.
Hypothesis
. That year seven boys will be smaller than year eight boys
2. That year seven girls will be smaller than year eight girls
3. That year eight boys will be smaller than year nine boys
4. That year eight girls will be smaller than year nine girls
5. That year seven boys will weigh less year eight boys
6. That year seven girls will weigh less year eight girls
7. That year eight boys will weigh less year nine boys
8. That year eight girls will weigh less year nine girls
9. That BMI of boys will be higher than that of girls
Sampling
I have chosen to sample 50 boys and 50 girls from a total 813 students, which is roughly 16 students from each year group. But the number students of each gender of each year group are not of equal number, as shown in the following table.
KS3 number of children in each year:
Male
Female
Total
Year seven
51
31
282
Year eight
45
25
270
Year nine
18
43
261
Total
414
399
813
Table 1
To find the proportionate number of year seven males for the sample to be use in this investigation, the table above suggests that I have to divide 151 by 414 the ration of year seven male pupils to total male students in my sample.
Multiplying this proportion by 50 will give the value of year seven males that I should use in this investigation. This is an example of stratified sampling which is applied for all genders and year groups as shown bellow.
Year Seven males = 151 / 414 × 50 = 18
Year Eight males = 145 / 414 × 50 = 18
Year Nine males = 118 / 414 × 50 = 14
Year Seven female = 131 / 399 × 50 = 16
Year Eight females = 125 / 399 × 50 = 16
Year Nine females = 143 / 399 × 50 = 18