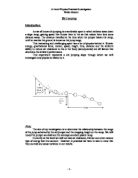
The dependent variable will be measured using the same metre ruler. After having released the skier I will measure the back edge of the crater formed by the marble on landing to the release point of the skier this will give me the distance in cm including the distance of x which is the horizontal distance between the release height of the skier and the edge of the landing tray which is filed with sand. Because x is constant I wil need to measure the egde of the tray to the point where the skier landed and add it to x.
To ensure a fair test I will check the spirit level before I take each reading, also I will use all the same apparatus and equipment each time a take a reading. I won’t move the landing tray between readings as I may alter the accuracy of my readings. I will have to ensure that H2 remains constant, as this also may affect the accuracy of my results, I will use the same marble for each test, and H1 will only increase in intervals of one centimetre for each reading taken. I will use the same piece of track for all of my readings and finally x will remain a constant horizontal distance from the starting point to the edge of the landing tray.
I should be able to measure the distance from x to the landing point to ± half a scale division, which is one millimetre, however I may not be able to achieve this degree of accuracy using only my eye. So I think that ±2mm is probably more accurate. The crater formed when the marble lands in the sand is also going to cause me a problem, I may not be able to determine where the end of the crater is as it may have been slightly mangled as the marble flies over it.
I will use a spirit level to ensure that x is completely horizontal beyond any reasonable doubt, also I will practice the release technique once or twice to get a clean release that won’t come off the end of the slope at an angle, as this may obscure my results. I will try to avoid parallax error by reading the ruler from eye level. I will repeat three times for each height at H1 and record the mean value.
To maintain the safety of myself and others around me I will limit the height of H1 to a maximum of 25 cm to prevent the skier reaching excessive distances that cant be measured I will maintain a clear working area and ensure there are no interfering fellow students in the way of my projectile and experiment.
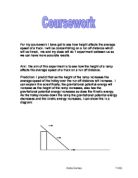
Proposed Analysis
I plan to use my average results to plot a length against height graph, as shown, to display my results.
Modification to plan
Before I conducted my experiment I checked the spirit level, I then checked what L is which I calculated at roughly 678mm, next I made sure the end of L is in line with the edge of the landing tray .Some additional equipment was used to conduct my experiment was; a set square, I used this to check how level the level piece of wood is and to position a marking point in the sand to measure from. Also the spirit level was used to judge if I could make the level piece of wood any more level.
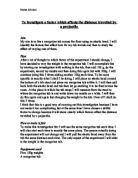
Practical Assessment – the ski jump
Results
I took three readings at each point that I released the skier from which I generated a mean; x is the height above the level where I started my experiment.
Analysis
I have observed a pattern in my results by looking at my graph. As the height of the starting point increases by one cm the distance travelled increases by roughly 0.8 cm on average this shows a linear relationship between the height of the starting point and the distance travelled.
I calculated a gradient of my graph which tells me how steep the graph I have drawn is. From this I can confirm any relationship in my results and see how far the skier will travel for any given release height.
Because I measured my release height in cm intervals my graph is already relatively complex however if, for example, I had taken readings every five cm and taken the same number of observations I would have graphed more of a curved line as opposed to the straight line that I obtained. This is because if you take your readings to a certain amount after hat time they will start to land closer and closer together resulting in a curved graph.
I have drawn error boxes on my graph so that I can get some idea of what region my answer could lie in. the boxes I have drawn are 2mm*2mm as 2mm is the most accurate I could get my observations due to parallax error. All my answers are rounded to four significant figures, as this is not only consistent but accurate also
From my results I can make an equation in the form y=mx+c where m is the gradient (0.400) y is the distance travelled and x is the height of the starting point (or release point) so when x is 20
20=(0.400*11.60)+c
20-c=0.400*11.60
20-c=4.640
20-4.640=c
c=15.36
so for any value of x, y can be determined by the equation:
y=0.400x+15.36
Evaluation
My readings were taken three times so a reliable average could be taken, I calculated a mean value and found for each observation; deviation from the mean was minimal. The major issues surrounding my accuracy are that of the parallax error. There were other errors such as the level ness of the sand but if anything were to dramatically affect my results it was parallax error. This type of error would occur in the measurements with my ruler. And could be avoided by some method of laser accuracy instrument where the light shines on the exact point where the measurement is to be taken, however I cannot afford to use this instrument in my experiment.
I took a mean reading of my results because if I had only taken the one set of results I could have produced a set of results very unreliable which in turn misleads me to the answer to the equation.
Conclusion
In conclusion to this I can say that the equation used to find the distance travelled by the skier (y) in relation to the height of the starting point (x) is y=0.400x+15.36 where 15.36 is the constant value.