Variables
We have been given a secondary database to use for our investigation, including both qualitative data and quantitative data – discrete and continuous. The following data is included in the Mayfield Data survey.
Data provided for each student:
Name, age, year group, intelligence quotient, weight, height, hair colour, eye colour, distance from home to school, usual method of travel to school, number of brothers or sisters, Key Stage 2 results in English, Mathematics, and science.
Upon these variables to choose from, we were asked to decide on a line of enquiry and come up with three hypotheses to investigate – applying our statistical techniques in the process.
Line of Enquiry:
The relationship between IQ and Key Stage 2 results.
Hypotheses:
In this coursework, I have chosen to investigate the following hypotheses:
1. Pupils with higher IQ will achieve higher KS2 results in Mathematics.
2. A pupil’s IQ does not affect their KS2 results in English.
3. The more TV a pupil watches per week, the lower results they will achieve in KS2.
Hypothesis 1
Pupils with higher IQ will achieve higher KS2 results in Mathematics.
Method:
For hypothesis number two, I will draw a scatter diagram to find if there is a correlation between high IQ and KS2 results in Mathematics. By using this method, there will be a clear pattern – then strength of the correlation is clarified by the Product Moment Correlation Coefficient (PMCC).
Data Analysis
Scatter diagram
I have chosen to use the scatter diagram because it can compare two sets of data and find out if there is any correlation between them. From this diagram below, there is a clear positive correlation between a pupil’s IQ and their KS2 mathematics results. These two variables are related since a person’s intelligence quotient will affect their performance at certain subjects that require mind work.
Product-Moment Correlation Coefficient
To clarify how strong the correlation between the two sets of data is, I have chosen to use the Product-Moment Correlation Coefficient (PMCC) method.
As you can see above, the formula shows that there is a strong positive correlation between the two sets of data, since the outcome is 0.78. When the outcome is 0.6 or greater yet less than 1 means there is a positive correlation.
Conclusion:
Simply based on the scatter diagram and the PMCC calculations I have done, I can conclude that there is a relationship between a pupil’s IQ and their KS2 mathematics results, because these two methods both show a positive correlation. My hypothesis was correct based on these results.
Evaluation:
Out of the scatter diagram and PMCC, the PMCC gave a better idea of how strong the correlation is, though the scatter diagram still gave a rough idea of a positive correlation. It was easy to draw a conclusion as the correlation was quite strong and obvious from the scatter diagram.
Hypothesis 2
A pupil’s IQ does not affect their KS2 results in English.
Method:
In hypothesis two, the scatter diagram has been used once again. To ensure the scatter diagram is correct, the product-moment correlation coefficient will re-assure that the correlation is valid. By working out the mean, it will tell me the average level of English within the class and the average IQ, to support my conclusion.
Data Analysis
As the scatter diagram shows above, there is a positive correlation between a pupil’s IQ and their KS2 results in English. As the intelligence quotient raises, the pupil’s KS2 results in English is better. The strength of the correlation is determined by the product-moment correlation coefficient.
Product-Moment Correlation Coefficient
Once again, the PMCC has clarified the strength of the correlation. In this case, the correlation is 0.82, which is quite strong (if the correlation is between 0.6 and 1 it is considered as a strong relationship).
Mean
English
The mean (average) will give an indication of the usual level in English, and the average IQ. Though is may provide such results, it can definitely be misleading as it will take into account all the extreme values (outliers).
=
=
= 4.11 (2 d.p.)
The average level in English is level 4, as it is shown above. I will then repeat the same method, except the numbers are substituted with IQ levels.
IQ
=
=
= 100.75 (2 d.p.)
The mean shows that the average IQ in the results in quite high, and the average level in KS2 English is about 4.
Conclusion
Upon the results gained from the methods I have chosen to use for this hypothesis, I can conclude that there is a strong positive correlation between a pupil’s IQ and their KS2 results in English, therefore proving my hypothesis of a negative correlation to incorrect.
Hypothesis 3
The more TV a pupil watches per week, the lower results they will achieve in KS2
Method
For hypothesis number three, I will use the scatter diagram and product-moment correlation coefficient once again. The scatter diagram will give a brief idea of whether it is a positive, negative, or no correlation at all.
Data Analysis
Scatter Diagram
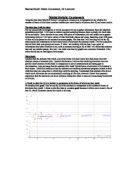
The scatter diagram below will give a brief indication of the correlation between the average number of hours of television watched per week, and the pupil’s overall KS2 result.
As you can see, there is a slight hint of positive correlation in the diagram, but it is only a very weak correlation. In order to check how strong the correlation is, the product moment correlation coefficient is used.
Product Moment Correlation Coefficient
This method will justify how strong the correlation was in the scatter diagram above.
According to my PMCC, I can now conclude that the correlation between these two sets of data is very weak, as the outcome is 0.07, which is considered weak or even unimportant since the value is so small.
Conclusion
Based on the methods I have used to prove my hypothesis right or wrong, all of the outcomes show a slight hint of positive correlation – therefore proving my hypothesis wrong.
Evaluation
If there was more time allocated to me, I would have surveyed what programs they watch the most – which genre it would fall into, such as educational or cartoons. This would enable me to investigate further whether or not the educational programs would have an affect on the intelligence quotient. Both the scatter diagram and PMCC was suitable for this hypothesis, as it gave a clear indication of the correlation.
Appendix
Estimated Standard Deviation
Standard deviation is a measure of how widely values are dispersed from the mean. Since we used the random sampling method, therefore estimated standard deviation is used, which is based on the 5% sample. The larger the dispersion of the data, the larger the value of the standard deviation. One disadvantage of the standard deviation is that it is more difficult to determine compared to other measures of dispersion and extreme values may have an affect the result as the deviation from the mean is squared. The standard deviation method is calculated using the ‘non-biased’ or ‘n-1’ method. Estimated standard deviation uses the following formula:
Product Moment Correlation Coefficient
Although the scatter diagram will determine whether two variables are correlated, you have no measure of the strength of this correlation. The product moment correlation coefficient (PMCC) will give an indication of the strength of correlation. The formula below is used:
Mean
The mean will give an indication of the average value in a set of data values. Although it gives the average, this can definitely be misleading as it takes into account all the extreme values. Nonetheless, the following formula is used: