Data Collection
When students take their SAT’s, one of the requirements is to fill out the survey or questionnaires for statistical references. These reports present data for high school graduates in the year of 2006, 2007, 2008, 2009 and 2010 who participated in the SAT Program. Students are counted only once, no matter how often they tested, and only their latest scores and most recent SAT Questionnaire responses are summarized. These reports are considered very highly accurate since the college-bound population is relatively stable from year to year.
Here are the URLs of the SAT total group reports from 2006 to 2010:
Total group reports in 2006
Total group reports in 2007
Total group reports in 2008
Total group reports in 2009
Total group reports in 2010
Analysis
First of all, descriptive statistics was used to discover any statistical significance on what is being observed. Using Microsoft Office Excel 2007 the data of the survey conducted by the Collegeboard.com were first arranged into graphical forms to see if there are any significant differences between the test takers’ scores and their parents’ highest level of education. Using mean values of SAT scores as dependent variables corresponding to levels of parental education as independent variables, several graphs were created. However, comparing and concluding only based upon the mean values of all the students’ SAT scores can lead to biased assumptions. In order to avoid this, the data were analyzed with inferential statistics technique called a test of homogeneity of chi-square distribution based on contingency tables. In a test of homogeneity, the claim is that different populations have the same proportions of some characteristics. Therefore, again, the main purpose using this hypothesis test is to determine whether the students’ SAT scores in 2006 and 2010 have the same proportions of the characteristics being considered, the highest level of parental education. The hypothesis testing, calculation of chi-square value and expected frequencies, p-values, and contingency tables were done by using Microsoft Office Excel 2007 and Statdisk. On the whole, the conclusion was simple: The SAT test-takers’ SAT scores are independent of the highest level of their parents education.
Conclusion
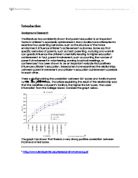
Consider the graphs below and let us explore if there is a significant relationship between the highest level of parental education and the students’ SAT scores.
Even though there appears to have a correlation between the parents’ educational degree and their students SAT scores, the overlapping of the standard deviation error bars (SD 100.8) for 2006 and (SD 99.6) for 2010 indicates that there is no significant difference between those critical reading scores of 2006 and 2010.
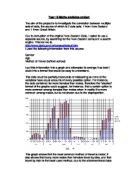
Consider similar graphs on mathematics and writing comparing 2006 to 2010.
S.D. 105.8 for average mathematic scores in year of 2006
S.D. 104.7 for average mathematic scores in year of 2010
S.D. 97.2 for average mathematic scores in year of 2006
S.D. 98 for average mathematic scores in year of 2010
Similarly, both of the math and wring scores do not show any statistical significant differences based upon the overlaps of the standard deviation error bars.
Now, since there is not enough evidence to conclude that the highest parental education does not affect the children’s SAT scores, inferential statistics has to come in and play a role in hypothesis testing.
When testing the null hypothesis of independence between the row and column variables in a contingency table, the requirements are described below.
1). The sample data are randomly selected, and are represented as frequency counts in a two-way table
2). The null hypothesis is the statement that the row and column variables are independent; the alternative hypothesis is the statement that the row and column variables are dependent.
3). For every cell in the contingency table, the expected frequency E is at least 5.
All the data below consist of independent frequency counts, each observation can be categorized according to two variables, and the expected frequencies are all at least 5. Because this is a test of homogeneity (two separated populations) and all the requirements are satisfied, the contingency table hypothesis testing was able to be proceeded. The test is to determine whether one population sample of students’ SAT scores in 2006 has the same proportion to the other population sample of the students’ SAT scores in 2010 arranged according to their highest parental education level.
Contingency Table of the Students’ Critical Reading Scores and their Parents’ Highest Education
Degrees of freedom: 4
Test Statistic, : 10.9515
Critical: 9.48772
P-value: 0.0271
Reject the Null Hypothesis
Data provides evidence that the rows and columns are related
Statdisk
The hypothesis testing of the critical reading scores and their parental education concluded that it provides enough evidence to reject the null hypothesis and support the claim that the proportions are different. Again, since the P-value which is 0.0271 is less than the significance level a = 0.5, the null hypothesis can be rejected. It appears that the students’ critical reading scores are dependent on the highest level of their parents’ education.
Contingency Table of the Students’ Mathematics Scores and their Parents’ Highest Education
Degrees of freedom: 4
Test Statistic, , : 40.3171
Critical , : 9.48772
P-Value: 0.0000
Reject the Null Hypothesis
Data provides evidence that the rows and columns are related
Statdisk
Contingency Table of the Students’ Writing Scores and their Parents’ Highest Education
Degrees of freedom: 4
Test Statistic, , : 25.0801
Critical , : 9.48772
P-Value: 0.0000
Reject the Null Hypothesis
Data provides evidence that the rows and columns are related
Statdisk
Again, since the all the P-value are very low which are all less than the significance level a = 0.5, and values are high, the null hypothesis can be rejected. The hypothesis testing of homogeneity concluded that it provides enough evidence to reject the null hypothesis and support the claim that the students’ overall SAT scores are dependent of the highest level of their parents’ education.