"THE TABLOID VERSUS THE BROADSHEET"AN INVESTIGATION INTO THE EDITORIAL AND PICTORIAL CONTENT OF THE DAILY MAIL AND THE GUARDIAN NEWSPAPERS
"THE TABLOID VERSUS THE BROADSHEET"
AN INVESTIGATION INTO THE EDITORIAL AND PICTORIAL CONTENT OF THE
DAILY MAIL AND THE GUARDIAN NEWSPAPERS
. INTRODUCTION
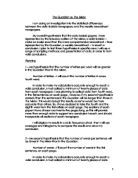
British newspapers fall loosely into two categories the tabloid (which is half the size of a broadsheet) and the broadsheet itself, with tabloid newspapers tending to be quite different from broadsheets in style and content as well as in size.
The so-called intelligent media represented by the Independent and the Guardian seem to present problems to their readers and say 'here is an article, judge for yourself from the information and the informed journalists that we offer.' Commentators such as the art critic Brian Sewell stated, "Opinion, as expressed by a rag is worthless" with Mark Thompson the Director of BBC Television, commenting, "I think people use the media in quite sophisticated ways. They might read a tabloid newspaper for fun but it doesn't mean they believe everything in it is true."
If you look on a news-stand, the British national newspapers can be roughly divided as follows:-
Broadsheet
Tabloid
The Guardian
The Daily Mail
The Independent
The Express
The Financial Times
The Star
The Telegraph
The Sun
The Times
The Mirror
The table shown above illustrates an example of a stratified sample. This type of sample is made up of different layers of the population (individuals or items) that are to be investigated. The sampling frame is divided into non-over lapping groups or strata e.g. geographical areas, age groups or in this case tabloid and broadsheet daily newspapers. Obviously, it is not possible to test every paper in the population so because of this a random sampling technique was used to select which papers were representative or typical of the whole population.
For the purpose of the course-work, the two newspapers, which were chosen, were the Guardian (broadsheet) and the Daily Mail (tabloid).
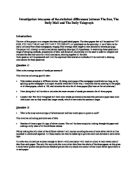
2. HYPOTHESES
Tabloids and broadsheets do look different by design not accident as each paper is trying to appeal to who it sees as its' core readership.
Hypothesis One
Both newspapers are deliberately written in a particular style with the assumption made that the tabloid stories are generally smaller in length with words that are shorter and easier to understand while broadsheet stories tend to be more in depth and have longer more complicated words.
Hypothesis Two
In general, tabloids make far greater use of advertisements and pictures than the broadsheets do with the total area of the paper allocated to images likely to be far greater in the tabloid than the broadsheet.
These two hypothesis will be tested in turn with the results commented on in Section Four onwards.
3. PLAN FOR HYPOTHESIS ONE
To minimise any possible bias that could potentially skew the results a system was devised so that no selection was more likely to happen than any other was. To achieve this each of the newspapers were put into their relevant groups and sorted alphabetically. They were then allocated a number between one and five. A dice was then thrown by a third party and the number that the dice landed on was noted. This number was then cross-referenced with the numbers allocated to each of the papers and the relevant papers were selected and purchased.
To begin the investigation three articles were chosen that covered the front-page lead of each paper, as well as a story, which covered the subjects of finance and sport.
Each of the articles was required to be purely text based and contain a minimum of three hundred words each. Any identified nouns with a capital letter and hyphenated words were ignored, as well as words that had one, two or three letters as these occur in all text as joining words.
The next step was to identify every third word and the number of letters it contained. This exercise continued until one hundred words and their corresponding letters were identified with the results compiled in frequency tables, which are shown in Section 4 - Data ...
This is a preview of the whole essay
Each of the articles was required to be purely text based and contain a minimum of three hundred words each. Any identified nouns with a capital letter and hyphenated words were ignored, as well as words that had one, two or three letters as these occur in all text as joining words.
The next step was to identify every third word and the number of letters it contained. This exercise continued until one hundred words and their corresponding letters were identified with the results compiled in frequency tables, which are shown in Section 4 - Data Collection.
The data gathered from each of the tabloid and broadsheet frequency tables were then aggregated as more information gives a more representative and accurate picture.
After the data had been collected it was then analysed and presented in a meaningful way using tables, bar charts and text. Finally, conclusions were made to ascertain if the hypothesis had been proven or not.
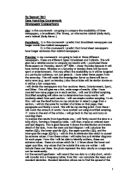
5.1 HYPOTHESIS ONE DATA COLLECTION AND ANALYSIS - FRONT PAGE LEAD
TABLOID
Article 1 - Front Page Lead
Letter (L)
Frequency (F)
Letter x Frequency
4
32
28
5
9
95
6
3
78
7
0
70
8
2
96
9
9
81
0
2
20
1
2
22
2
2
Totals
00
602
Table 1
Mode: 4 Letters Mean: 6.02 Median: 5 Range: 8
BROADSHEET
Article 1 - Front Page Lead
Letter (L)
Frequency (F)
Letter x Frequency
4
34
36
5
8
90
6
4
84
7
8
56
8
0
80
9
6
54
0
7
70
1
2
22
2
2
Totals
00
604
Table 2
Mode: 4 Letters Mean: 6.04 Median: 5 Range: 8
5.1 HYPOTHESIS ONE DATA COLLECTION AND ANALYSIS - FRONT PAGE LEAD CONTINUED
Bar Chart 1
N.B.For the purpose of the chart the mean figures taken from Table 1 and 2 have been rounded down.
5.1.1 ANALYSIS AND INTERPRETATION
After analysing the results for the two tables and the bar chart it was surprising to identify that there was no difference in the values for the mode, median and range.
An exception to this related to the mean value, as the Guardian's average length of words was 6.04, which was 0.02 higher than the Daily Mails mean of 6.02.
Relating back to Hypothesis One, there was an expectation that the values for the broadsheet would be higher than that of the tabloid. However, as this comparison is based on one article these results cannot be used in isolation to prove or disprove the theory in question.
5.2 HYPOTHESIS ONE DATA COLLECTION AND ANALYSIS - FINANCE
TABLOID
Article 2 - Finance
Letter (L)
Frequency (F)
Letter x Frequency
4
40
60
5
25
25
6
9
54
7
8
56
8
9
72
9
5
45
0
4
40
Totals
00
552
Table 3
Mode: 4 Letters Mean: 5.52 Median: 5 Range: 6
BROADSHEET
Article 2 - Finance
Letter (L)
Frequency (F)
Letter x Frequency
4
23
92
5
5
75
6
4
84
7
6
12
8
4
12
9
8
72
0
3
30
1
4
44
2
3
36
TOTALS
00
657
Table 4
Mode: 6 and 7 Letters Mean: 6.57 Median: 6 Range: 8
5.2 HYPOTHESIS ONE DATA COLLECTION AND ANALYSIS - FINANCE CONTINUED
Bar Chart 2
N.B.For the purpose of the chart the mean figures taken from Table 3 and 4 have been rounded to 1 decimal place.
5.2.1 ANALYSIS AND INTERPRETATION
As illustrated in Tables 3, 4, and Bar Chart 2, it is apparent that the Guardian has a greater range of eight compared to the Daily Mails range of six.
This difference is due to the broadsheet article having longer and presumably more complicated words, which contain between 4 and 12 letters with the average length being 6.6 letters. Conversely, the tabloid article had shorter and therefore easier words of between 4 and 10 letters with an average of 5.5 letters.
The mode values support this as four letter words featured most frequently in the Mails article compared to the Guardian whose article featured both seven and eight letter words the most.
This trend in comparisons continued with the Guardian having a higher value for the mean and median of 6.6 and 6 contrasted with the Mails values of 5.5 and 5 respectively.
5.3 HYPOTHESIS ONE DATA COLLECTION AND ANALYSIS - SPORT
TABLOID
Article 3 - Sport
Letter (L)
Frequency (F)
Letter x Frequency
4
50
200
5
6
80
6
2
72
7
3
21
8
0
80
9
3
27
0
3
30
1
3
33
Totals
00
543
Table 5
Mode: 4 Letters Mean: 5.43 Median: 5 Range: 7
BROADSHEET
Article 3 - Sport
Letter (L)
Frequency (F)
Letter x Frequency
4
26
04
5
9
95
6
1
66
7
4
98
8
1
88
9
9
81
0
5
50
1
1
2
2
3
2
26
4
4
TOTALS
00
645
Table 6
Mode: 4 Letters Mean: 6.45 Median: 6 Range: 10
5.3 HYPOTHESIS ONE DATA COLLECTION AND ANALYSIS - SPORT CONTINUED
Bar Chart 3
N.B.For the purpose of the chart the mean figures taken from Table 5 and 6 have been rounded to 1 decimal place.
5.3.1 ANALYSIS AND INTERPRETATION
As illustrated in Tables 5, 6, and Bar Chart 3, the values indicate that the Guardian has a greater range of ten compared to the Daily Mails range of seven. When compared to the values of the previous article it shows that the range has steadily increased from six to seven for the Mail and from eight to ten for the Guardian. These results are surprising as it was anticipated that the range for the financial article would have been greater due to the subject matter being generally considered more complex.
The broadsheet article had a greater number of longer words, which contained between four and fourteen letters with the average word length being 6.5. With the tabloid article having shorter words of between four and eleven letters with an average word length of 5.4.
The mode for both of the articles was four; however, the Mail had a frequency of almost 50% more than the Guardian did with fifty counts compared to twenty-six.
When analysing the mean and median the trend from the previous finance article continued with the Guardian having values of 6.5 and 6 compared with the Mails values of 5.4 and 5 respectively.
5.4 HYPOTHESIS ONE DATA COLLECTION AND ANALYSIS AGGREGATED TABLES
5.4.1 INTRODUCTION
The discrete data shown in the frequency tables for articles one, two and three for each of the tabloid and broadsheet papers were aggregated into two separate tables, shown below. This approach was taken as grouped data has increased accuracy and is therefore more representative when compared against one isolated set of data.
TABLOID TOTAL
Letter (L)
Frequency (F)
Letter x Frequency
4
22
488
5
60
300
6
34
204
7
21
47
8
31
248
9
7
53
0
9
90
1
5
55
2
2
TOTALS
300
697
Table 7
Mode: 4 Letters Mean: 5.66 Median: 5 Range: 8
BROADSHEET TOTAL
Letter (L)
Frequency (F)
Letter x Frequency
4
83
332
5
52
260
6
39
234
7
38
266
8
35
280
9
23
207
0
5
50
1
7
77
2
5
60
3
2
26
4
4
TOTALS
300
906
Table 8
Mode: 4 Letters Mean: 6.35 Median: 6 Range: 10
Bar Chart 4
N.B. For the purpose of the chart the mean figures from Tables 5 and 6 have been rounded to 1 decimal place.
Bar Chart 5
5.4.1 ANALYSIS AND INTERPRETATION
As shown in the Tables 5 and 6 and the Bar Charts 4 and 5 the discrete data from each of the three individual articles was compiled into one set of data. This exercise was taken because the greater amount of statistics gathered is generally more representative of the sample, which should lead to a higher degree of accuracy.
As illustrated in the tables and charts it is apparent that the Guardian has a greater range of ten, compared to the Daily Mails range of eight.
The reason for this is that the aggregated broadsheet articles had longer words, containing between four and fourteen letters. Conversely, the aggregated tabloid articles had a greater number of words with fewer letters, which ranged from four to twelve lettered words.
The data also showed that the most frequent mode for each of the newspapers was four letters. The tabloid newspaper the Daily Mail supported hypothesis one by having the largest amount of smaller words by having a frequency of 122 four letter words compared to 83 in the Guardian with this trend continuing for the five letter words also. This trend
Hypothesis one was also proven as overall the Guardian had the largest word-length of 6.35 compared to the Daily Mails 5.66.
5.5 EVALUATION AND CONCLUSION
The comments in section 5.4.1 illustrate that hypothesis one has been tested and was proven conclusive.
However, as the results were recorded using papers that were bought on one day out of seven for these results to have a greater degree of accuracy and credence, this exercise would need to be repeated over a longer period using a broader sample of broadsheet and tabloid newspapers.
6. PLAN FOR HYPOTHESIS TWO
To source the data to prove or disprove hypothesis two a page from the tabloid and the broadsheet newspapers were chosen with the proportion of text, advertisements and pictures measured, with the results shown below:
Newspaper
Text
Pictures
Advertisements
Broadsheet
0%
0%
00%
Tabloid
25.4%
62.5%
2.1%
Table 9
This primary data was then included with the other sets of secondary data to obtain eighty separate pieces of statistics which are shown in Appendix A.
To minimise any possible bias that could potentially skew the results the random number function on the calculator was used to select thirty-one numbers which detailed the proportion of text, pictures and advertisements that had been measured and gathered by the other pupils.
To begin the investigation the thirty-one lines of data were arranged into three frequency tables depicting the data for text, advertisements and pictures for both the tabloid and broadsheet newspapers.
The data was then displayed in three cumulative frequency graphs, one manually using graph paper and the other two using the Autograph software program so the results could be compared and comments made, please see Appendix B and C and D. To support this comparison box and whisker plots were also used with comments and results shown in Section 6.1-6.2 - Data Collection.
6.1 HYPOTHESIS TWO DATA COLLECTION AND ANALYSIS - CUMULATIVE FREQUENCY TABLES
TABLOID TEXT
PERCENTAGE %
Frequency (F)
Cumulative Frequency (CF)
0-10
5
5
1-20
0
5
21-30
3
8
31-40
9
41-50
5
4
51-60
2
6
61-70
9
25
71-80
4
29
81-90
2
31
91-100
0
31
Table 10
BROADSHEET TEXT
PERCENTAGE %
Frequency (F)
Cumulative Frequency (CF)
0-10
9
9
1-20
3
2
21-30
4
6
31-40
5
21
41-50
4
25
51-60
3
28
61-70
3
31
71-80
0
31
81-90
0
31
91-100
0
31
Table 11
TABLOID PICTURES
PERCENTAGE %
Frequency (F)
Cumulative Frequency (CF)
0-10
1
1
1-20
2
21-30
5
7
31-40
2
9
41-50
4
23
51-60
2
25
61-70
5
30
71-80
31
81-90
0
31
91-100
0
31
Table 12
BROADSHEET PICTURES
PERCENTAGE %
Frequency (F)
Cumulative Frequency (CF)
0-10
8
8
1-20
7
5
21-30
0
25
31-40
5
30
41-50
31
51-60
0
31
61-70
0
31
71-80
0
31
81-90
0
31
91-100
0
31
Table 13
TABLOID ADVERTISEMENTS
PERCENTAGE %
Frequency (F)
Cumulative Frequency (CF)
0-10
9
9
1-20
4
3
21-30
4
7
31-40
8
41-50
3
21
51-60
0
21
61-70
22
71-80
0
22
81-90
0
22
91-100
9
31
Table 14
BROADSHEET ADVERTISEMENTS
PERCENTAGE %
Frequency (F)
Cumulative Frequency (CF)
0-10
0
0
1-20
6
6
21-30
3
9
31-40
3
22
41-50
3
25
51-60
0
25
61-70
0
25
71-80
26
81-90
0
26
91-100
5
31
Table 15
6.2 HYPOTHESIS TWO DATA COLLECTION AND ANALYSIS - BOX PLOTS
TABLOID TEXT
BROADSHEET TEXT
TABLOID PICTURES
BROADSHEET PICTURES
6.2 HYPOTHESIS TWO DATA COLLECTION AND ANALYSIS - BOX PLOTS CONTINUED
TABLOID ADVERTISEMENTS
BROADSHEET ADVERTISEMENTS
6.2.1 ANALYSIS AND INTERPRETATION
As indicated in Table 10 and 11 and supported by the cumulative frequency graphs the overall proportion of text, in percentage terms was greater in the broadsheet newspaper when compared with the tabloid. This was illustrated by the broadsheets median of 60% compared to the tabloids median of 30%. The broadsheets upper and lower quartiles were 69% and 30% respectively. This compared against the tabloids quartile values of 48% and 9%.
Conversely, the proportion and use of pictures and advertisements was higher in the tabloid when compared with the broadsheet. This was illustrated in Tables 12 and 13, which showed that 80% of the pages were used to depict images compared to 50% in the broadsheet. Surprisingly, the allocation of advertisements between the two papers was closer than anticipated. However, as shown in Tables 14 and 15 the proportion of advertising was higher in the tabloid.
These results illustrate that in general tabloids make far greater use of advertisements and pictures than broadsheets. This also shows that the tabloid allocates more of its pages to images than it does to text.
6.3 EVALUATION AND CONCLUSION
The comments in the previous section illustrate that hypothesis two has been tested and is proven to be correct.
As mentioned previously in section 5.5 these results would have a greater degree of reliability and authenticity if the same exercise was repeated over a longer time-span using a larger representation of the population.
GCSE MATHS - DATA HANDLING COURSEWORK
Submitted By Sue Allan-Hooks