From the graph with the price and age you will see that the slope that goes down steeply showing the price dropping as going up in age.
I am also going to find the drop in price by diving the price by age, then I am going to find the percentage drop for the price by dividing the drop in price with the original price, then times it by 100.
Once I have found the percentage drop I use it to find the depreciation for the percentage drop for each year of all the cars by dividing the age of the cars and I will also put the cars in groups of make and then I will find the average percentage drop for each year.
Table 1 on the next page will show the drop in price for each car in £ and table 2 will show the percentage drop for the price.
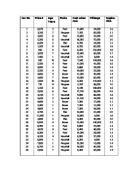
Table 1
Table 2
Tables 3
The table above shows the average percentage each car drops every year and also it shows the average percentage drop as well and is put into groups of make so it easier to find the percentage drop the individual depreciation per year as it may not be constant. From the tables it shows that the make of the car does affect the prices of the used cars as you can see that the fords have a low percentage drop, which will indicate that people bought cars that were fords then another make. The fiat make has the lowest percentage drop but since there is very little data about them to compare with the other makes the percentage drop could be unreliable. As you can see from the tables the drop in price is not near the average depreciation.
I am now going to compare the mileages with the prices then I will then divide it by the ages and will find the averages to see how much the mileages drop from each car price, which I think that the make of the car will affect this as well.
From the tables it shows mileage drop each year and their annual drop as well. The average drops of the makes of the car range from 2.36-5.70. Cars no 6, 7, 9, 10, 16, 17, 18, 26, 28, 34, 35 and 36 are the ones that have a unusually high or low prices in mileage and in price as shown in the first table and the factor affecting the price and mileage is probably the age and make
Next I am going to look at the prices themselves. I split the prices into ranges of 1000 and the graph shows the median and the inter-quartile range.
From the data above it proves that the age and the mileage are the two most leading deciding factors of the price and the depreciation of a car. The size of engine however does not affect this by comparing it with the tables and using the depreciation to do this and that there are 12 cars with unusual mileage and age.
I have also found out that the age and price both have a negative correlation using a scatter graph to do this.
Next I could find the main contributing factors to the price is using the standard and inter-quartile range and majority range for the prices.