Body mass index or BMI is the measurement of choice for many physicians and researchers studying obesity. BMI uses a mathematical formula that takes into account both a person's height and weight and equals a person's weight in kilograms divided by height in meters squared. (BMI=kg/m2).
The table below states the ranges in which body mass index applies. For example under 18.5 for a BMI is underweight and over 40 is extremely obese.
Firstly, I am going to differentiate between males and females in the raw data provided. To do this the data will be grouped and split leaving two tables of each gender. To calculate the BMI of each person in each gender table the mathematical formula will be used, (as shown above) and the gender tables, in turn will then be split again into two other tables of random sampling and stratified sampling. The BMI will be used as an average comparison for each means of transport to school and will be put into bar graphs to demonstrate this. To further determine the imperfections of the tests, a BMI graph (height against weight) will be constructed to show how the results can be faulty and how a generalizing of students is easily possible.
The random sample will be obtained by indiscriminately choosing sixteen girls and sixteen boys from each table and using the obtained data as relevant data. The number sixteen was chosen randomly also as it was seen as a substantial number to use.
The stratified sample will be acquired by taking a sample of fourteen from the females and sixteen from the males. The stratified sample is established by using the arithmetical formula (shown above). I chose a sample of thirty because the total is two hundred and eighty two (rounded up to three hundred), and I found ten percent. The sample is useable since sixteen plus fourteen is thirty. This is approving the above calculation.
Hypothesis
From my plan I believe that as the mode of transport (speed) increases, the laziness of each student on their journey to school increases. For example, the students who walk from home to school will have a lower body mass index than those who take a car as their means of transport to school. I expect that the students who take the bus or tram to school will have similar results for their BMI because they are similar means of transport. I also believe that the BMI graphs to be constructed will display how there are imperfections in the tests and the ways of obtaining data.
Preliminary Work
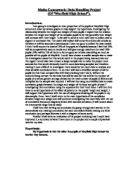
To give myself a broader understanding of the variable that I shall be testing, I am going to test the distance between the student’s home and their school against their body mass index. I will test this by taking a random sample for each gender.
Male:
Female:
Above are the results and graphs for male and female, random samples, demonstrating the distance between home and school against body mass index. Both graphs exhibit a lack of any type of correlation as the points are all in a random order and it clearly shows that there is no relationship between these particular variables.
Refine and Redesigned plan
Because of this preliminary result, I have decided to pursue the idea of using means of travel to school against BMI. This graph is the male random sample and clearly shows that there is positive correlation in the bar graph.
Data Collection and Diagrammatic Representation
Random male and female sample results:
Male:
Female:
Stratified male and female sample results:
Male:
Female:
Random male and female sample graphs:
Male:
Female:
Stratified male and female samples graphs:
Male:
Female:
Interpretation
My results were not affected by the type of sampling I used, because I used random and stratified sampling for the variable of BMI against means of travel to school and the results were as random as each other. I firstly used a male, random sample and it seemed to be as if there was positive correlation as the BMI increased steadily as the means of travel to school became faster. Because of this I thought that for each sample and gender this would occur. This proves that each sampling technique are at similar degrees of accuracy. There was no correlation.
This lack of correlation can be due to many things. It was generalising to state that every person in the year who walks to school has a lower BMI then anyone that take the car to school.
An abundance of school children are overweight and obese nowadays and lunches could be one of the main problems behind this. Boiled potatoes served with fish cakes and green salad for lunch to schoolchildren could vastly help the obesity by providing them with healthy diets. This has not happened, although the British government has just decided to invest tens of millions to provide a fresh daily fruit to every school pupil in Britain.
British children are not just fatter than ever before. They are also pickier than ever. Seven out of ten UK parents have to bribe their children to finish their meals, reveals a questionnaire survey carried out by the Safeway grocery store chain. One in ten of the children whose parents responded to the study even demanded that food be arranged on the plate in a certain way.
British playgrounds include rather a lot of fat kids. Government figures show that 22 per cent of schoolchildren are overweight. The Food Standards Agency has called the obesity problem “a ticking time bomb”, and there have been apocalyptic predictions that today’s children could die before their parents, struck down by unprecedented levels of Type 2 diabetes and coronary heart disease. Adults too are getting lardier, despite the deluge of advice about walking more, eating more vegetables and joining a gym.
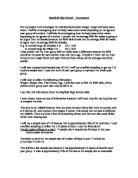
Below are the BMIs for the males and females in the year 7 and these show how many of the children in the year are under or overweight. If someone is between the two lines, they are considered to be the right weight in comparison to their height. As the graphs convey, the majority of students are between the lines and, therefore, the right weight and height. However, there are a lot of students that are under the line and are underweight and many that are over the line and are overweight. The reasons and possibilities for this are expressed above.
Conclusion
I conclude that my hypothesis is incorrect and that what I stated about the BMI increasing as the mode of transport increasing is inaccurate. Instead, the results were completely random for each gender and sample and the fact that I obtained positive correlation for the first set of results was a fluke. The result had no structure and a couple of times the people who walked had the highest BMI. The BMI graphs just further emphasised the random results and showed the range of result used.