What affects the stopping distance of a toy car
What affects the stopping distance of a toy car
Planning
There are many factors, which affect the stopping distance of a car. There are many factors, here are a few of them:
* Speed of car
* Mass of car
* Surface that car is on
* Height of ramp
* Starting point on ramp
* Aerodynamicness of the car
The independent variable I have chosen to investigate is the height of the ramp, and I will keep all of the others constant. I will make this a fair test by not changing the speed of the car, i.e. pushing it down the ramp faster, thus taking longer to stop, as it will gain more kinetic energy. Not changing the mass of the car i.e. adding more weights on top of the car, causing it to have more inertia, therefore making it harder to stop, not changing the surface the car is on i.e. concrete to gravel to carpet etc, as some may cause more friction than others, thus causing the car to slow down faster, starting the car from the same place on the ramp, as it may gain more speed will going down the ramp. I must also not change the car I will be using, as some have different axels, which may cause them to slow down faster.
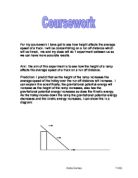
I predict that the greater the height of the ramp, the further the stopping distance would be. I feel that this is because the higher the ramp, the more G.P.E (gravitational potential energy) it will have. This is because G.P.E =(mass(kg)*g (n/kg))*height(m), therefore the higher the ramp, the higher the G.P.E, the more energy it will have, thus increasing the stopping distance of the car as it will take longer for the forces working against the car (i.e. friction etc) to stop it. In our experiment we will not be changing the mass of the car or the gravity as these two will always be constant in this experiment, therefore here the G.P.E is dependent on the height of the ramp. It may be that when I double the height of the ramp, I double the G.P.E, which then doubles the time for the car to stop. Therefore, I could say that the height of the ramp and the time it takes for the car to stop are directly proportional to each other.
Here is a prediction of the graph that I expect to find
I will take 8 readings, making the ramp 5cm higher each time. I will start off with the ramp at 5cm, then 10cm, 15cm, 20cm, 25cm, 30cm, 35cm and 40cm. This will hopefully give me a large range of results, sufficient enough to allow me to get a good set of results for a valid analysis and evaluation.
Method
. Gather apparatus
2. Weigh the car
3. Place ramp on top of blocks
4. Draw on starting place of ...
This is a preview of the whole essay
Here is a prediction of the graph that I expect to find
I will take 8 readings, making the ramp 5cm higher each time. I will start off with the ramp at 5cm, then 10cm, 15cm, 20cm, 25cm, 30cm, 35cm and 40cm. This will hopefully give me a large range of results, sufficient enough to allow me to get a good set of results for a valid analysis and evaluation.
Method
. Gather apparatus
2. Weigh the car
3. Place ramp on top of blocks
4. Draw on starting place of car on ramp
5. Place car on lamp and let go
6. Measure the distance travelled from the bottom of the ramp
7. Repeat
8. Change height and go through the same procedure
Diagram
Preliminary experiment
For my preliminary experiment I have chosen to test out which car is the best to use, and the where I let go of the car on the ramp.
Results 1
Type of car
Height of ramp/cm
Distance travelled/cm
Bus
0
86
Sports car
0
N/A
Noddy car
0
N/A
Evaluation
From the three cars I tested in my preliminary experiment I have found out that the bus drove straight, while the sports car and the Noddy car didn't even make it off the ramp. This may have been because the axels of the car were unaligned, making it harder for the car to drive straight. It is important to find a car that travels straight as it will give more accurate and reliable results.
Results 2
Height of ramp/cm
Starting point on ramp/cm
Distance travelled/cm
0
5
5
0
20
32
0
40
75
Evaluation
This shows me that the starting point on the ramp was an important factor as it altered the results a lot. I will have to keep the car on the same place on the ramp throughout my experiment to allow me to bet more reliable, consistent results. Also, I found building up the ramp with blocks was very hard to do and still keep the results reliable and fair, as they went up in odd numbers and you were unable to control the sizes of the blocks e.g. some went up in 3cm, while others went up in 12cm. To change this and make the experiment more accurate and trustworthy, I will use a clamp stand to alter the height, as with this I can get the exact height I want without having to fiddle about with countless blocks of wood.
This experiment is quite harmless, but there are always rules that you must abide by to keep safe in the lab. For example, don't run in the lab, don't play around with equipment, and don't eat or drink in the lab.
Final experiment
Results
Height of ramp /cm
Stopping distance/ cm (repeat 1)
Repeat 2
Repeat 3
Average
(1 d.p)
Mass of car/g
G.P.E (joules)
5
58
59
60
59
46
3304
0
95
96
00
97
46
5432
5
52
51
47
50
46
8400
20
95
212
216
208
46
1648
25
256
261
260
259
46
4504
30
283
288
282
284
46
5904
35
332
344
348
341
46
9096
40
396
387
386
390
46
21840
Analysis
My graph basically shows me that as I increase the height of the ramp, the stopping distance for the car also increases. My graph is a straight line through the origin, telling me that the stopping distance of the car is directly proportional to the height of the ramp. The gradient of the graph seem to be constant throughout, and does not change. I have chosen to work out the gradient of the from the origin, as this is the most precise result possible, as when there is no height, the car doesn't move, therefore there is no stopping distance. The gradient of the graph is vertical/horizontal, and it works out to be y=10x. This shows me that every unit on the x-axis, will be 10 times more on the y-axis, e.g. if the height of the ramp is 10cm, then the stopping distance will be 100cm, therefore telling me that height of the ramp is directly proportional to the stopping distance.
The fact that the stopping distance increases when the height of the ramp increases could be down to many scientific reasons, one of these is G.P.E. When I change the height of the ramp, I also change the G.P.E along with it. The calculation to work out G.P.E is as follows:
G.P.E =(mass(kg)* g(n/kg))*height(m)
Therefore, if I increase the height, I increase the G.P.E of the car, and if I decrease the height I decrease the G.P.E of the car and so on. If the car has more G.P.E, then it will take longer to stop, as the forces working towards it, will find it more difficult to reduce that energy to bring the car to a halt, therefore increasing the stopping distance of the car. I have proven that the G.P.E increases in my table above. When the height of the ramp was 5cm high, the G.P.E was 3304j, however when the ramp was 40cm high, the G.P.E was 21840j, which is 6.6 times more. Also, when the ramp was 5cm high, the stopping distance of the car was 59cm, but when the ramp was 40cm high the stopping distance was 390cm, which is also 6.6 times more, which also tells me that G.P.E is proportional to the stopping distance.
The results that I gathered in my final experiment went a long way to prove that my original prediction was correct. I originally predicted that as I increase the height of the ramp, I will also increase the stopping distance, and I also suggested that they will be directly proportional to each other, drawing a predicted straight line graph which went through the origin, and once I put my results into a graph I found out that my prediction was correct.
Evaluation
I found that my experiment was fairly easy to do and was reasonably easy to obtain results. I had to change my method slightly after doing my preliminary experiment. I had to change the way I built up the ramp, which was instead of using blocks of wood, I used a clamp stand instead, with this new method, I could easily get the selected heights I waned with out too much trouble, which altogether gave a fairer test, which led to more accurate and reliable results.
I feel that my results are quite accurate, as most of the points stick to the best-fit line I drew on the graph, and no results strayed severely of the line, with three falling slightly off it, but this is nothing major. There are many things that could have led to our results being inaccurate and unreliable. For example, even though I tried hard to set the height of the ramp correctly, I may have gone slightly over or below the desired height, which I needed, as the metres rulers we slightly worn, and hard to distinguish where the marks were. To improve this I could have used brand new rulers, which may have helped a lot on the readings I would have taken.
Also, I measured the results with my own judgement and if my vision wasn't perfect, then I may have measured the results slightly incorrectly, by a few mm's. There are not many things that can be done to improve this side of the experiment. Furthermore, the axels of the vehicle may have become damaged while conducting the experiment, thus causing our results to be inaccurate. I could have improved this by using a new car, therefore you will know that the car is undamaged and untouched, which will mean the axel will be in perfect shape, allowing us to get better, more accurate results.
In addition to this, the last few result (40cm), were travelling very far, and in the small room, it was difficult to try and avoid crashes, and just allow the car to travel without being intercepted by something. We could have improved this by doing our experiment in a larger room, which had more space and less people working in it.
I feel that I obtained enough results to attain a valid conclusion. I feel I used a large range of results, and 3 repeats all helped make my experiment more accurate and reliable. Altogether, I took 24 results, which was enough to draw a suitable graph. I feel that if I went above 40cm, the results I would have got would have been to large for the circumstances I was in.
I could extend this experiment further I could obviously take more results, to find out if the graph will curve off at the end or will continually progress in the manner it is. I could also use different mass cars to see how that will affect the stooping distance. Furthermore, I can change different variables, e.g. speed of car, surface, aerodynamicness of the car, etc. From this I will be able to find out if the trend that I found out in my experiment was not just an isolated event.
Andrew Papasavva 11 Dolbe Physics