In expiration at rest is a passive process and is due the relaxation of the muscles and diaphragm and the elastic recoil of the elastin fibres in the connective tissue. The ribs move down and in due to the relaxation of the external intercostal and scalene muscles and the diaphragm returns to its resting dome shape and pushes upwards on the thoracic cage. These processes reduce the volume of the thorax. The elastic recoil passively drives air out as the lungs and chest wall return to their original shape. During forced expiration a different set of muscles become active. Muscles of the abdominal wall contract, forcing the diaphragm upwards reducing the volume of the thoracic cavity. The internal intercostal muscles contract to bring the rib cage downwards accelerating the expulsion of air.
Skeletal muscles provide the force for breathing and as they have no pacemaker activity, they depend entirely on the nervous system for stimulus to contract. There are two separate neural systems that control respiration; voluntary control and automatic control. Voluntary control originates in the cerebral cortex whilst the automatic control originates in respiratory centres in the pons and medulla.
The medullary neurons generate the rhythm for involuntary breathing sending impulses to the inspiratory muscles at a rate of 12-15 times per minute. During heavy exercise neurons that send impulses to the expiratory muscles become active but under normal breathing conditions they remain quiet, as expiration is passive at rest. There are several factors, which influence the respiratory centres. If lungs become over inflated stretch receptors send impulses to the medulla to inhibit inspiration and so protecting the lungs from mechanical damage. The proprioceptors are located in the muscle, tendons and joints and are sensitive to movement, sending impulses to the respiratory centres to help to increase ventilation during exercise.
As respiration key roles are to provide oxygen, remove carbon dioxide and maintain body pH reflexes related to amount of these blood chemicals in the plasma are very important. PCO2 is the most important of these reflexes. When plasma PCO2 levels rises they are matched with an increase in ventilation, removing more CO2 from the blood returning levels to normal. Similarly if the levels of PCO2 in the plasma drop then ventilation slows until CO2 accumulates bringing the levels back up to normal. This reflex is very sensitive and increasing the arterial PCO2 by 1mmHg will stimulate an increase in the ventilation by about 3L per minute. The change in blood PCO2 is detected by central chemoreceptors located in the medulla. They respond to changes in PCO2 via H+ ions. CO2 diffuses easily from the blood through the blood-brain barrier into the cerebrospinal fluid. Here it is converted into HCO3- and H+ by reacting with H2O. A rise in CO2 results in a rise in H+ ion concentration. This rise in H+ ion concentration is detected on the ventral surface of the medulla leading to the stimulation of the respiratory centres and increased rate and depth of breathing.
Low PO2 and low pH levels are detected and responded to by the peripheral chemoreceptors. These receptors are found in the aortic and carotid bodies and are O2 sensitive receptors. A response is caused as K+ ion channels close in low PO2. This results in membrane depolarization leading to the opening of Ca2+ channels and initiates the secretion of dopamine. Dopamine is a neurotransmitter and stimulates the sensory nerves, increasing the frequency of impulses sent to respiratory centres and therefore increases ventilation. This reflex doesn’t appear to play a vital role in day-to-day ventilation as the arterial PO2 has to be significantly reduced. However it is important when PO2 falls below 60mmHg for example when at high altitudes or during hypoventilation.
During exercise a noticeable change in PCO2 and PO2 would be expected however this is not the case, as their levels remain nearly constant. This is due to ventilation keeping pace with metabolism and removing CO2 as fast as its produced and supplying O2 as fast as its consumed.
As stated before the respiratory system is divided in the conducting and respiratory zones. As the conducting zone does not perform gas exchange it is referred to as the anatomical dead space and has a volume of around 150ml. The volume of air, which leaves the alveoli to be exhaled, is 500ml but only 350ml reaches the atmosphere as 150ml remains in the airways or dead space. Each time air is inhaled only 350ml out of the 500ml tidal volume is fresh air, the other 150ml is stale air from the last exhalation. Alveolar ventilation is a more accurate way to look at efficiency of ventilation, as pulmonary ventilation doesn’t take into consideration the volume of the anatomical dead space.
Alveolar ventilation = (tidal volume – dead space) x breaths per min
Pulmonary ventilation or respiratory minute volume = tidal volume x breaths/min
Therefore an individual with a small tidal volume but high number of breaths per minute may have the same respiratory minute volume as an individual with a large tidal volume but lower number of breaths per minute. However the individual with the small tidal volume would have much lower alveolar ventilation and would be breathing less efficiently as they use a lot of effort in moving the air back and forth in the dead space. So it is more efficient to breath more deeply than it is to increase the rate of breathing.
Key
Figures are for textbook male.
Capacity = sum of two or volumes
Methodology
Data will be collected using a spirometer under three conditions:
- Control (at rest whilst standing)
- After holding breath for 30 seconds
- After moderate exercise
The data that will be collected is breathing rate and tidal volume from this the respiratory minute volume can be calculated. Also the inspiratory and expiratory reserve capacities will be recorded but only for the control. This is recorded when the subject is standing, after holding breath for around 30 seconds and after 3 minutes of moderate exercise. The results are recorded using a spirometer where a mouthpiece is placed in the subject’s mouth and records the volume being inspired and expired as well as the rate. A nose clip is also used to prevent any air either entering or escaping through the nose, which would affect the results. This will then be recorded on a program called spirometry adicht. This allows a trace of the breathing to be recorded and can be magnified to calculate the inspiratory and expiratory reserve volumes. To record the inspiratory and expiratory reserve volumes the subject breathed normally for 5-6 breaths then breathed out as far as they could then breathed in as far as they could. The normal inspiratory volume was then subtracted from the highest inspiratory volume to give the inspiratory reserve volume. To work out the expiratory reserve volume the normal expiratory volume was subtracted from the lowest expiratory volume. The exercise taken by the group was stepping up and down on an aerobic step. This was done at a moderate pace. The pace of exercise was controlled using a light bulb, which flashed at regular intervals. The subjects had to step up on to the step each time the light flashed.
Results
Key: TV= tidal volume, RR= respiratory rate, RMV= respiratory minute volume
Above are the results for the group. It is evident that there is a lot of variation in results within the group.
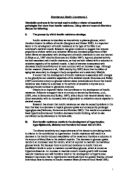
This is the spirometry trace at rest and below is a magnified image, which is labelled with tidal volume, expiratory reserve volume, inspiratory reserve volume, vital capacity and residual volume. Residual volume cannot however be measured using a spirometer. From the trace it can be identified that the tidal volume is almost double the textbook figure. This may be due to a number of reasons: this is the first result taken and the mouthpiece may have felt strange and so caused still stress making the individual breath more deeply.
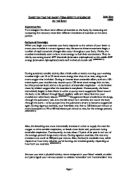
This is the trace for holding breath. There was a period of normal breathing before breath was held. After breath was held the tidal volume had moved up and the rate increased compared to the control. But as the rate of breathing increased as well as a small increase in tidal volume there was a marked increase in respiratory minute volume.
This is the trace after three minutes of exercise. It is clear from the trace that the tidal volume is much larger and the breathing pattern appears to be more irregular. There was also a noticeable increase in the breathing rate between the control and after exercise. As there was a substantial increase in both breathing rate and tidal volume, as significant increase in respiratory minute volume would also be expected. The respiratory minute volume for the after exercise results was more than double that of the control.
The graph above is the average group results for tidal volume under the three conditions. The standard error is also show. It is relatively small for the control but much larger for the results after holding breath. It appears there is a marked stepped increase from the control to after exercise. I would have expected the have expected the tidal volume to have increased slightly more compared to the control. The Mann-Whitney U test was performed, comparing data to the control. It found there was no a statistically significant difference between the control and after holding breath tidal volumes as P= 0.241. As expected the difference between the control and after exercise for the tidal volume median values is greater than would be expected by chance and there is a statistically significant difference as P = 0.002.
The graph above is the average group results for respiratory rate. The standard error is also show. It is much smaller for the after holding breath and after exercise compared to the standard error for the tidal volume results and the standard error appears to have remained the same for the control. The results here show a similar trend to the results above but the difference between the control and after holding breath results is smaller. However the increase in breathing rate was not great enough to be deemed statistically significant as the difference in the median values between the control and after holding breath is not great enough to exclude the possibility that the difference is due to random sampling variability and the value of P = 0.226.
There was also a noticeable increase in the breathing rate for after exercise and the difference between the control and after exercise was also found by the Mann-Whitney U test to be statistically significant as P = 0.003.
The graph above is the average group results for respiratory minute volume under the three conditions. Again it is relatively constant for the control results and after exercise results. The results here show a similar trend to the results for the tidal volume but the difference between the results is more marked. The standard error for after holding breath has increased compared to the respiratory rate graph but decreased compared to the tidal volume. As expected the difference between the control and after exercise median values is greater than would be expected by chance and there is a statistically significant difference as P = 0.002. The difference between the respiratory minute volume median results for the control and after exercise was greater than would be expected by chance as P = <0.001 and so the difference was statistically significant. Unlike the other two values the difference in the median values for respiratory minute volume between the control and after holding breath was greater than would be expected by chance and there was a statistically significant difference as P = <0.001.
Discussion
Most of the group results fitted in with what I expected as the tidal volume increased for both the results after holding breath and after exercise when compared to the control results. As the respiratory system is divided in the conducting and respiratory zones with the conducting zone not performing gas exchange it is more efficient to breath more deeply than it is to increase the rate of breathing. This is due to the anatomical dead space, which has a volume of around 150ml and retains 150ml of the air exhaled from the alveoli. Therefore each time air is inhaled only 350ml out of the 500ml tidal volume is fresh air, the other 150ml is stale air from the last exhalation. The increase in volume is needed for both after holding breath and after exercise. It is needed after holding breath as whilst the breath is being held no more oxygen is coming into the body and no carbon dioxide is leaving the body. However as the subjects were standing muscles would need to be contracting to maintain posture and this requires ATP.
ATP is obtained via cellular respiration occurring in the cytoplasm and mitochondria of the cell. ATP is also needed for the constant anabolic synthesis processes in the body as well as for the brain and heart. Respiration requires two things; glucose and oxygen and produces water, carbon dioxide and energy.
As no carbon dioxide can leave the body via the lungs to the atmosphere the PCO2 in the blood increases. The PCO2 levels in the blood are detected by the central chemoreceptors located in the medulla. They respond to changes in PCO2 via H+ ions. CO2 diffuses easily from the blood through the blood-brain barrier into the cerebrospinal fluid. Here it is converted into HCO3- and H+ by reacting with H2O. A rise in CO2 results in a rise in H+ ion concentration. This rise in H+ ion concentration is detected on the ventral surface of the medulla leading to the stimulation of the respiratory centres and increased rate and depth of breathing. This reflex is very sensitive and increasing the arterial PCO2 by 1mmHg will stimulate an increase in the ventilation by about 3L per minute.
Low PO2 levels are detected and responded to by the O2 sensitive peripheral chemoreceptors found in the aortic and carotid bodies. A response is caused by the K+ ion channels closing resulting in the initiation of the secretion of dopamine. Dopamine is a neurotransmitter and stimulates the increase in the frequency of impulses sent to respiratory centres and therefore increases ventilation. This reflex doesn’t appear to play a vital role in day-to-day ventilation as the arterial PO2 has to be significantly reduced. However it is important when PO2 falls below 60mmHg for example during hypoventilation, which would occur if breath was held.
However the subjects only held their breath for around 30 seconds so it is unlikely that there would have been a large rise in arterial PCO2 or a large drop in PO2. Some of the subjects held their breath for longer than 30 seconds and some less than 30 seconds and this may account for the large standard error for tidal volume results after holding breath.
The same is true for results after exercise, as this would increase respiration as the muscles are contracting more frequently and more strong and ATP is needed in the formation of active cross-bridges between the actin and myosin fibres. During exercise a noticeable change in PCO2 and PO2 would be expected however this is not the case, as their levels remain nearly constant. This is due to ventilation keeping pace with metabolism and removing CO2 as fast as its produced and supplying O2 as fast as its consumed and so this indicates the both rate of breathing as well as depth of breathing are important during exercise.
The results for after exercise and after holding breath for respiratory rate show a similar trend as both increased when compared to the control results. The proprioceptors are located in the muscle, tendons and joints and are sensitive to movement, sending impulses to the respiratory centres to help to increase ventilation during exercise. So when exercise was under taken the proprioceptors may have been partly responsible for the increase in respiratory rate after exercise.
There were variations in the results for the group; this could be due to a numbers of factors. These factors are:
- Age
- Fitness
- Whether the individual was a smoker or former smoker
- Whether the individual had a cold or other illness which may reduce their ability to breath normally
- Height or size
- Gender
The control tidal volume had the most variation and the factors above would tend to affect this, as taller people tend to have a larger tidal volume compared to shorter people and fitter people tend to have a larger tidal volume compared to less fit people. The pace or intensity at which exercise was taken would have had an effect on the after exercise results. Not all the may have been group following the same pace of exercise, to improve this I would use a treadmill as a form of exercise as the pace can be determined and the group must stick to the pace to avoid falling over.
Another problem is that breathing is controlled by automatic and voluntary systems. Therefore an individual could in theory slow or quicken their breathing voluntarily by looking at the screen. To prevent this the individuals would either face the opposite direction or wear a blindfold.